Free Access
Fig. 6
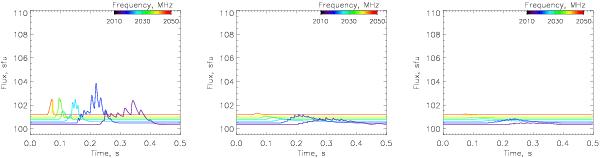
Time profiles of the observed radio flux in sfu including the quiet-Sun background, averaged over frequency bands ν to ν + Δν for Δν = 5 MHz at ν as shown in the colour bar. Left to right, top to bottom: homogeneous plasma, and inhomogeneities with τD = 2.4 s and 0.24 s.
This figure is made of several images, please see below:
Current usage metrics show cumulative count of Article Views (full-text article views including HTML views, PDF and ePub downloads, according to the available data) and Abstracts Views on Vision4Press platform.
Data correspond to usage on the plateform after 2015. The current usage metrics is available 48-96 hours after online publication and is updated daily on week days.
Initial download of the metrics may take a while.