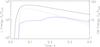
Fig. 3
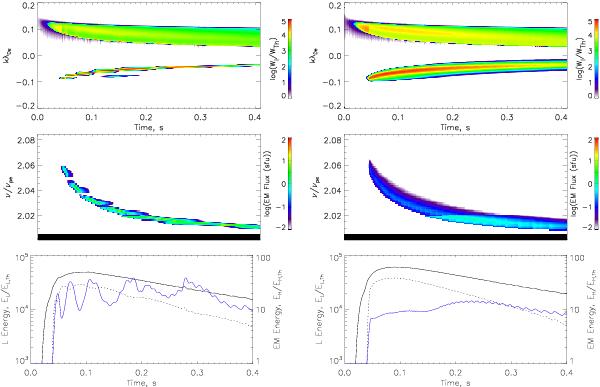
Langmuir wave spectral energy density and radio emission in sfu over the first 0.4 s of beam evolution. Top: Langmuir wave spectral energy density W(k) normalised to the thermal level, against wavenumber k on the vertical axis, and time on the horizontal axis. Middle: the radio flux in sfu as a function of frequency, ν = ω/(2π), including the effects of absorption during propagation. The source size and plasma density profile are as described in the text, and the observed background flux from a thermal source of this size is ~10-2 sfu. Bottom: the total energy in Langmuir waves (solid line), backscattered Langmuir waves (negative wavenumber) only (dotted line), and radio emission (blue line), normalised by the thermal levels, against time. The left panel shows homogeneous plasma, the right, inhomogeneities with τD ≃ 2.4 s.
Current usage metrics show cumulative count of Article Views (full-text article views including HTML views, PDF and ePub downloads, according to the available data) and Abstracts Views on Vision4Press platform.
Data correspond to usage on the plateform after 2015. The current usage metrics is available 48-96 hours after online publication and is updated daily on week days.
Initial download of the metrics may take a while.