Fig. 6
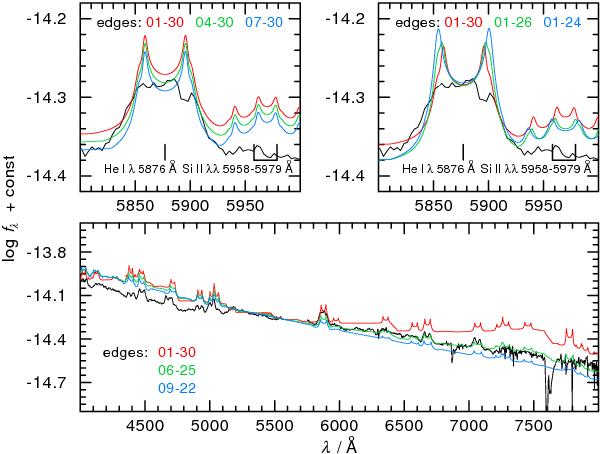
Model spectra for accretion disks with different extensions, compared to the observation (black line). Shown are the changes of the inner edge (top left panel), the outer edge (right), and simultaneous changes (bottom) under i = 40 °. The given numbers correspond to the disk rings in Fig. 1. For clarification, the computed spectra are shifted vertically (from top to bottom; top panels: −0.03, −0.06, −0.09; bottom panel: + 0.05, 0.00, −0.05).
Current usage metrics show cumulative count of Article Views (full-text article views including HTML views, PDF and ePub downloads, according to the available data) and Abstracts Views on Vision4Press platform.
Data correspond to usage on the plateform after 2015. The current usage metrics is available 48-96 hours after online publication and is updated daily on week days.
Initial download of the metrics may take a while.