Fig. 8
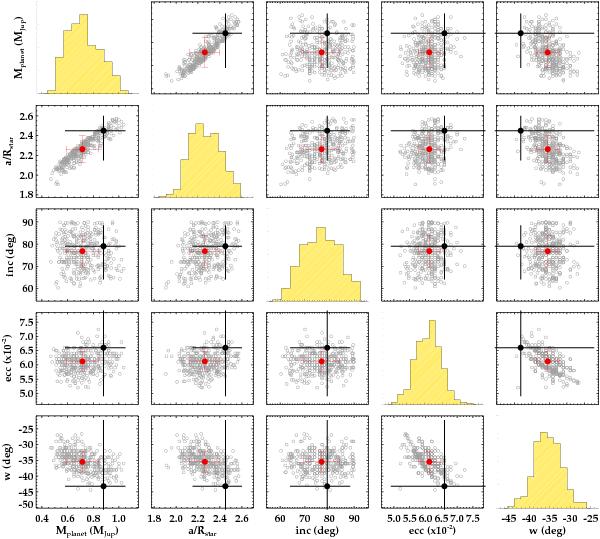
Possible solutions for the REB modulation fitting (see Sect. 4.2). Each grey open circle (and its correspondent error bars) represents a possible solution for the REB modulations whose χ2 value is statistically valid as compared to the minimum χ2 obtained with the genetic algorithm. We have marked the adopted model in black, being the one that presents the least relative errors. The red symbol corresponds to the most repeated value (and standard deviation deviation) for each parameter in the whole set of statistically acceptable solutions.
Current usage metrics show cumulative count of Article Views (full-text article views including HTML views, PDF and ePub downloads, according to the available data) and Abstracts Views on Vision4Press platform.
Data correspond to usage on the plateform after 2015. The current usage metrics is available 48-96 hours after online publication and is updated daily on week days.
Initial download of the metrics may take a while.