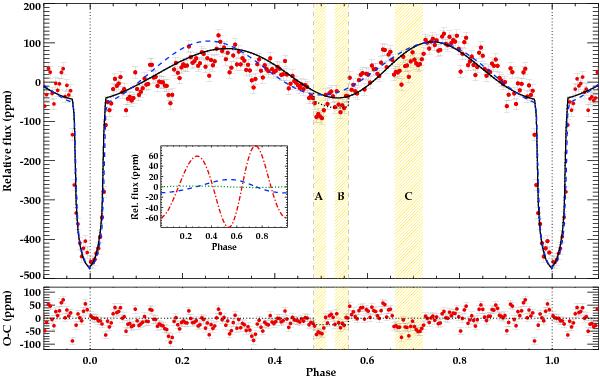
Fig. 7

Best-fitted model to the REB modulations for an assumed circular orbit (dashed blue line) and the best model for a non-circular orbit (solid black line). Red circles show the folded light curve assuming the period obtained by the Kepler team and binned to 29.4 min intervals (similar to the real cadence of observations. In the small panel we show the individual contributions of ellipsoidal (red dotted-dashed line), reflection (blue dashed line), and Doppler beaming (green dotted line). The lower panel shows the residuals after substracting the non-circular model to the observed data. The three shadowed regions marked as A, B, and C represent the three detected dims (see Sect. 4.3). The theoretical location of the secondary eclipse according to the architecture of the system is marked with vertical grey dashed lines in the upper panel. By removing the contribution of the planet reflection in this region, we obtain the dotted black line.
Current usage metrics show cumulative count of Article Views (full-text article views including HTML views, PDF and ePub downloads, according to the available data) and Abstracts Views on Vision4Press platform.
Data correspond to usage on the plateform after 2015. The current usage metrics is available 48-96 hours after online publication and is updated daily on week days.
Initial download of the metrics may take a while.


