Fig. 5
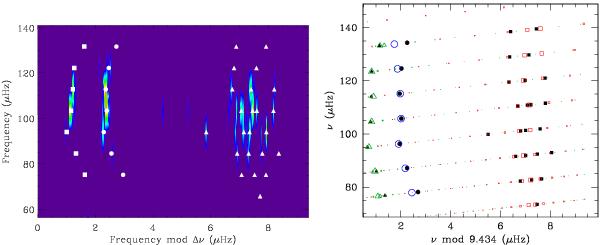
Left: échelle diagram of the power spectrum of the data with the fitted modes overplotted. Circles for l = 0, triangles for l = 1, and squares for l = 2. The power spectrum is fitted using maximum likelihood estimation (see Sect. 3.5.2). Right: comparison between observational (black solid dots and white symbols in the left panel) and theoretical (open symbols) frequencies in the échelle diagram for a typical good fitting of radial and non-radial modes. Circles correspond to radial modes, squares to dipole modes, and triangles to quadrupole ones. The size of the theoretical symbols is an indication of the expected amplitude based on the value of the inertia mode (Houdek et al. 1999). The asymptotic period spacing for this model is 76 s.
Current usage metrics show cumulative count of Article Views (full-text article views including HTML views, PDF and ePub downloads, according to the available data) and Abstracts Views on Vision4Press platform.
Data correspond to usage on the plateform after 2015. The current usage metrics is available 48-96 hours after online publication and is updated daily on week days.
Initial download of the metrics may take a while.