Fig. 10
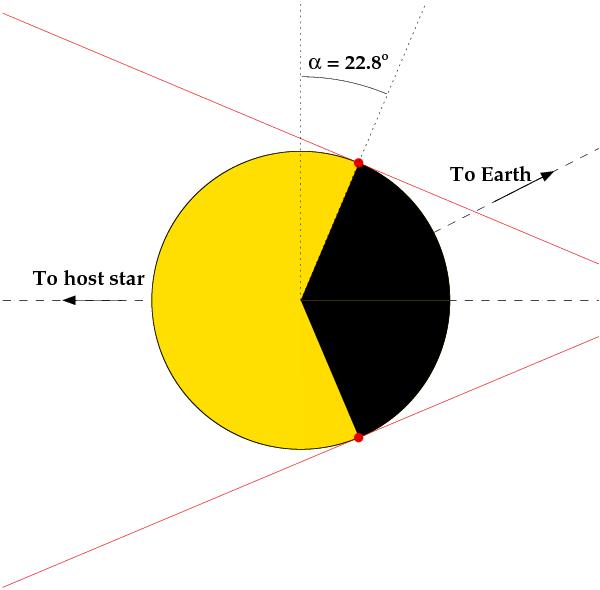
Diagram illustrating the irradiation of the host star onto the planet surface at mid-transit. The red lines represent the boundaries of the stellar irradiation that hits the planet surface. The yellow part represents the dayside according to our best solution for the system. The black part represents the night side, and the red one is the extra region illuminated due to the close-in orbit and the large stellar radii.
Current usage metrics show cumulative count of Article Views (full-text article views including HTML views, PDF and ePub downloads, according to the available data) and Abstracts Views on Vision4Press platform.
Data correspond to usage on the plateform after 2015. The current usage metrics is available 48-96 hours after online publication and is updated daily on week days.
Initial download of the metrics may take a while.