Fig. 1
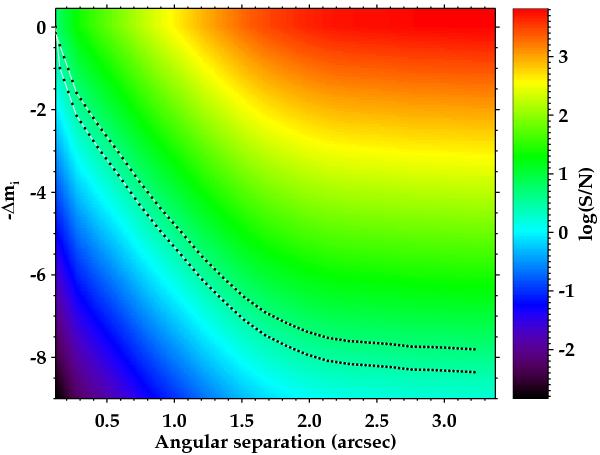
Contrast map of our high-resolution image taken with the 2.2 m telescope plus AstraLux at Calar Alto Observatory. Colour code corresponds to the S/N with which we would detect a theoretical source with a magnitude difference Δmi (y-axis) at the corresponding angular separation (x-axis). The two dotted lines represent the 3σ (lower line) and 5σ (upper line) contours.
Current usage metrics show cumulative count of Article Views (full-text article views including HTML views, PDF and ePub downloads, according to the available data) and Abstracts Views on Vision4Press platform.
Data correspond to usage on the plateform after 2015. The current usage metrics is available 48-96 hours after online publication and is updated daily on week days.
Initial download of the metrics may take a while.