Fig. 5
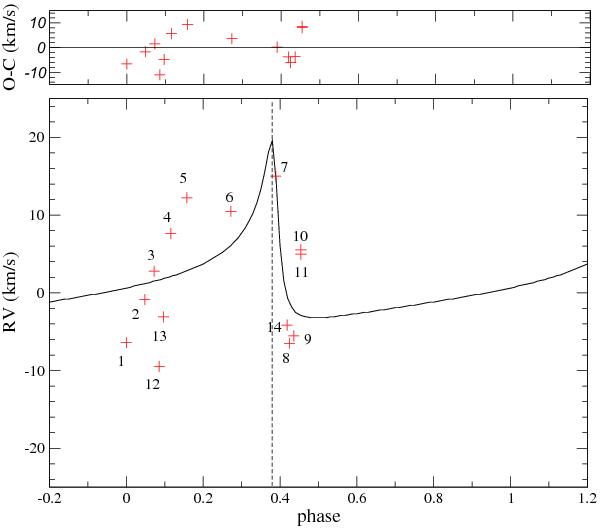
Radial velocity curve folded on the 164.6-d period derived from the X-ray observations, with phase zero chosen to be the time of the first observation. The dashed line marks the time of X-ray peaks. The thick line represents a typical radial velocity curve for an eccentric orbit with the periastron phase at this time (see Sect. 4.2). The numbers identify the observations, as in Table 1.
Current usage metrics show cumulative count of Article Views (full-text article views including HTML views, PDF and ePub downloads, according to the available data) and Abstracts Views on Vision4Press platform.
Data correspond to usage on the plateform after 2015. The current usage metrics is available 48-96 hours after online publication and is updated daily on week days.
Initial download of the metrics may take a while.