Fig. 6
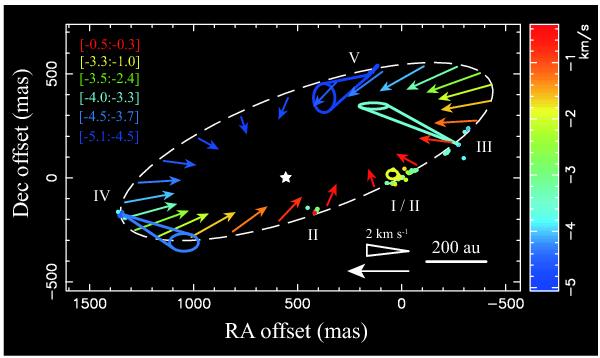
Superimposition plot of the maser distribution (Fig. 2) and the detected proper motions (upper panel in Fig. 5) on the fitted disk model (lower panel in Fig. 5). Colors of the maser spots and the model arrows indicate the LSR velocity (color-velocity conversion code shown on the right of the plot). Colors of the cones associated with each maser cluster indicate the LSR velocity, with the range of the velocities within a cluster ([min:max]) shown in the top left corner. The scale for the amplitude of the arrows and the cones is shown in the bottom right corner.
Current usage metrics show cumulative count of Article Views (full-text article views including HTML views, PDF and ePub downloads, according to the available data) and Abstracts Views on Vision4Press platform.
Data correspond to usage on the plateform after 2015. The current usage metrics is available 48-96 hours after online publication and is updated daily on week days.
Initial download of the metrics may take a while.