Fig. 4
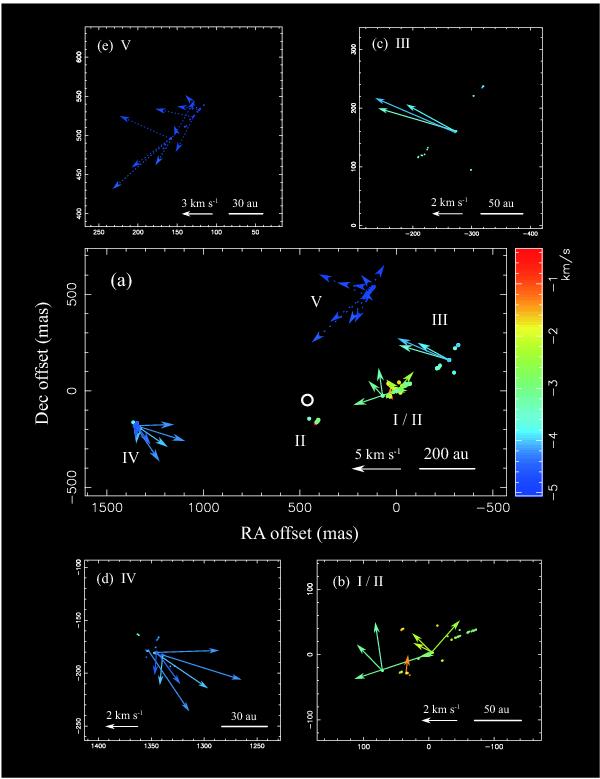
Proper motions of the 6.7 GHz methanol maser emission in Cep A relative to the barycenter (see Sect. 3.2). Arrows show the direction of the measured proper motions (solid line: using three epochs, dotted line: only two epochs). Arrow length is proportional to the magnitude of the tangential velocity. The spatial and velocity scales are shown at the lower right corner in each panel. The filled circles show the position of the maser spots. The open circle indicates the barycenter of epoch 1. a) Entire map, b)–e) Close-up maps for clusters I/II, III, IV, and V, respectively.
Current usage metrics show cumulative count of Article Views (full-text article views including HTML views, PDF and ePub downloads, according to the available data) and Abstracts Views on Vision4Press platform.
Data correspond to usage on the plateform after 2015. The current usage metrics is available 48-96 hours after online publication and is updated daily on week days.
Initial download of the metrics may take a while.