Fig. 2
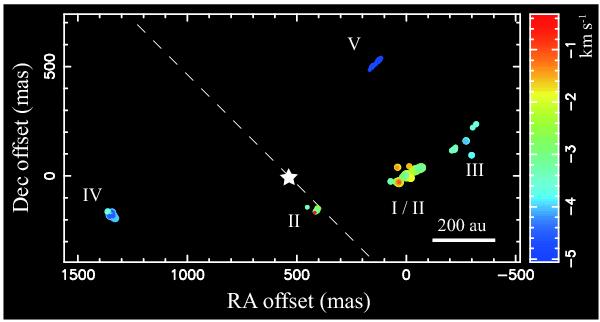
Spatial distribution of the 6.7 GHz methanol maser spots in Cep A (filled circles). The size of the circles is proportional to the peak intensity on a logarithmic scale, and the color indicates the l.o.s. velocity (color-velocity conversion code shown on the right of the plot). The spatial scale is shown by the ruler in the bottom-right corner. The roman numerals identify the maser clusters emitting the spectral features shown in Fig. 1. The star symbol indicates the peak of the 43 GHz continuum emission, which is known to a positional accuracy of 10 mas (Curiel et al. 2006). The dashed line shows the direction of the high-velocity collimated radio jet (Curiel et al. 2006). The origin of the map corresponds to the position of the reference 6.7 GHz methanol maser emission at LSR velocity of −2.60 km s-1 [α(J2000.0) = 22h56m17s.9042, δ(J2000.0) = +62°01′49″.577], as determined by Sugiyama et al. (2008a).
Current usage metrics show cumulative count of Article Views (full-text article views including HTML views, PDF and ePub downloads, according to the available data) and Abstracts Views on Vision4Press platform.
Data correspond to usage on the plateform after 2015. The current usage metrics is available 48-96 hours after online publication and is updated daily on week days.
Initial download of the metrics may take a while.