Fig. 16
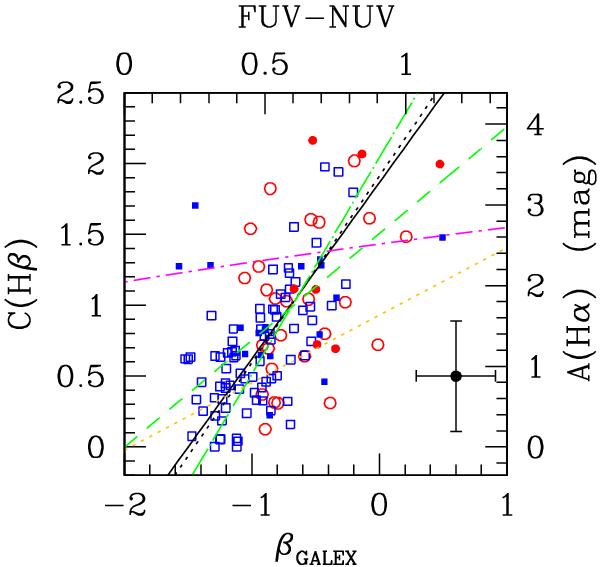
Relationship between the Balmer decrement C(Hβ) and the UV slope βGALEX determined using GALEX data. Blue symbols are for galaxies with a normal HI gas content (HI – def ≤ 0.4), red symbols for HI-deficient objects (HI – def > 0.4). Filled symbols are for galaxies hosting an AGN. The black cross shows the typical uncertainty on the data. The solid black line indicates the best bisector fit to our data when all galaxies are included, the dotted line excluding AGNs. The dotted orange line shows the fit obtained by Hao et al. (2011), the long-dash-dotted green line and the dashed line the best fits for normal and starburst galaxies by Cortese et al. (2006), and the short-dash-dotted magenta line that for GAMA/H-ATLAS galaxies of Wijesinghe et al. (2011).
Current usage metrics show cumulative count of Article Views (full-text article views including HTML views, PDF and ePub downloads, according to the available data) and Abstracts Views on Vision4Press platform.
Data correspond to usage on the plateform after 2015. The current usage metrics is available 48-96 hours after online publication and is updated daily on week days.
Initial download of the metrics may take a while.