Fig. 14
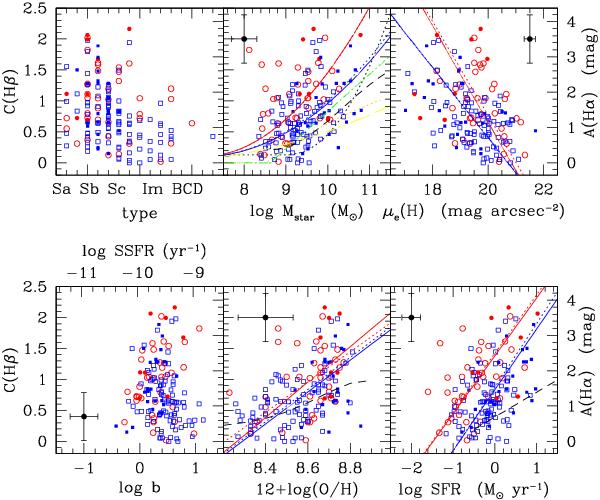
Relationship between the Balmer decrement C(Hβ) and various parameters characterising the observed galaxies. From left to right, upper row: morphological type, logarithm of the total stellar mass (in M⊙), H band effective surface brightness (in mag arcsec-2); lower row: logarithm of birthrate parameter b or equivalently specific star formation rate SSFR, metallicity index 12 + log (O/H), and star formation rate SFR (in M⊙ yr-1). Blue symbols are for galaxies with a normal HI gas content (HI – def ≤ 0.4), red symbols for HI-deficient objects (HI – def > 0.4). Filled symbols are for galaxies hosting an AGN. The black cross shows the typical uncertainty on the data. The blue and red lines indicate the best fit to the data for HI-normal and HI-deficient galaxies respectively whenever evident correlations are present. Solid lines indicate the best fit obtained including all galaxies, the dotted lines excluding those objects hosting an AGN. The black dotted line indicates the relation obtained by Gilbank et al. (2010) using SDSS data (increased by 13% to take into account the difference between the two extinction laws used in their article, from Seaton 1979, and in our work, from Fitzpatrick & Massa 2007). The short-dashed black line indicates the relationships obtained by Garn & Best (2010) using SDSS, increased by 30% to take into account the difference between our extinction law and that used in their work (Calzetti et al. 2000). The dotted orange line is the best fit for 0.75 ≤ z ≤ 1.5 galaxies given by Dominguez et al. (2012), the long-dashed yellow, line is the relation obtained by Lee et al. (2009) once B band absolute magnitudes are transformed into stellar masses using the relations log LH = −0.455 × MB + 1.289 and B − V = 0.711 × log LH − 4.439, combined with the relations given in Boselli et al. (2009) for measuring stellar masses. The dot-dashed green line is the best fit given in Boselli et al. (2009).
Current usage metrics show cumulative count of Article Views (full-text article views including HTML views, PDF and ePub downloads, according to the available data) and Abstracts Views on Vision4Press platform.
Data correspond to usage on the plateform after 2015. The current usage metrics is available 48-96 hours after online publication and is updated daily on week days.
Initial download of the metrics may take a while.