Fig. 2
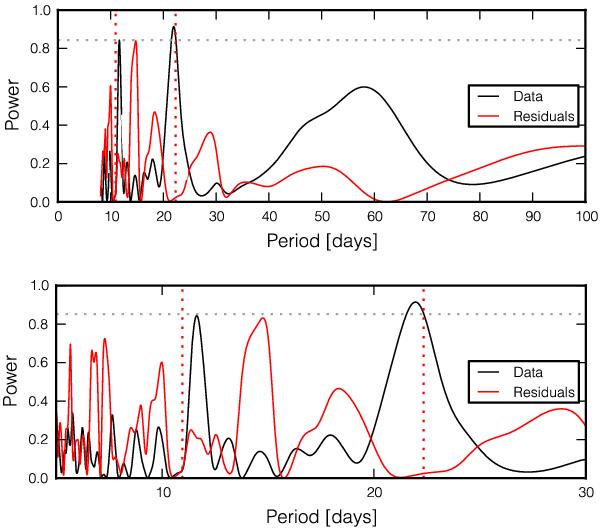
Top: generalised Lomb Scargle periodogram of the SOPHIE RV data. A peak is present at around 22 days. The FAP 10% level is shown as a dashed horizontal line. The periods reported by Nesvorný et al. (2013) are marked with vertical dashed lines. The Lomb Scargle periodogram of the residuals is shown in red. Bottom: zoom for periods between 5 and 30 days.
Current usage metrics show cumulative count of Article Views (full-text article views including HTML views, PDF and ePub downloads, according to the available data) and Abstracts Views on Vision4Press platform.
Data correspond to usage on the plateform after 2015. The current usage metrics is available 48-96 hours after online publication and is updated daily on week days.
Initial download of the metrics may take a while.