| Issue |
A&A
Volume 561, January 2014
|
|
|---|---|---|
| Article Number | A105 | |
| Number of page(s) | 5 | |
| Section | Interstellar and circumstellar matter | |
| DOI | https://doi.org/10.1051/0004-6361/201322980 | |
| Published online | 16 January 2014 | |
Observations of the early stages in the formation of an LBV shell
1
Centro de Radioastronomía y Astrofísica, Universidad Nacional
Autónoma de Mexico, A.P. 3-72
(Xangari), 58089
Morelia, Michoacán Mexico
e-mail: This email address is being protected from spambots. You need JavaScript enabled to view it.
2
Instituto de Astronomía, Universidad Nacional Autónoma de
Mexico, A.P.
70-264, 04510
Mexico,
Mexico
e-mail: This email address is being protected from spambots. You need JavaScript enabled to view it.
Received:
5
November
2013
Accepted:
6
December
2013
Abstract
Luminous blue variables are massive stars that undergo a series of eruptive events through which they shed their outer layers before becoming Wolf-Rayet stars. During the eruptive events, their winds are denser and expand slower than in the non-eruptive state. In this paper we apply a model for the interaction of the post-eruption fast wind with the slower moving shell of dense material that was ejected during the 1994 eruption of HD 5980, a massive system located in the Small Magellanic Cloud. The model predicts a velocity for the working surface that is consistent with the velocity of insterstellar-like absorption features observed in HST/STIS spectra of 1999 and 2000, leading to the conclusion that we have witnessed for the first time the earliest stages of a circumstellar shell being formed around an LBV.
Key words: ISM: general / stars: individual: HD 5980 / stars: winds, outflows / stars: variables: general / stars: massive
© ESO, 2014
1. Introduction
Luminous blue variables (LBV) are stars in the evolutionary transition stages between OB-type stars and Wolf-Rayet stars (Langer et al. 1994; Maeder & Meynet 1987; Langer 2012). In addition to powerful stellar winds, these stars undergo episodic mass-shedding events, referred to as eruptions, through which the H-rich outer layers are removed. The physical processes involved in these events are not yet understood (Vink 2012), but the observational evidence indicates that they produce transitions back and forth from a fast and low-density stellar wind to a slow and dense wind.
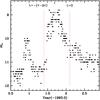 |
Fig. 1 Eye-estimates of the visual magnitude obtained by A. F. Jones (priv. comm.) covering the time of the 1993–1994 eruptive events. Here we plot only data corresponding to orbital phases out of eclipse, and a correction of +0.6 mag was applied to the original data to make it compatible with photometric determinations. The dash lines mark the times that are used as input parameters for the interacting wind model described in Sect. 2. |
During the alternating periods of “quiescence” in which the fast stellar wind prevails, it collides with the previously emitted slow flow, leading to the formation of an outward propagating interaction zone that may be observed as a shell. Indeed, this process is believed to be responsible in part for shaping circumstellar nebulae such as the Homunculus in η Carinae (Frank et al. 1995; García-Segura et al. 1996; González et al. 2004a,b, 2010), although it has seldom been observed in its early stages. LBVs are very rare and the timescale over which the fast-wind overtakes the ejecta is very short, making such observations extremely unlikely.
The Small Magellanic Cloud (SMC) system HD 5980 contains an LBV that in 1994 underwent a brightening of ~3 mag in the visual wavelengths (Fig. 1) accompanied by a brief episode of enhanced mass loss with wind velocities in the range ~200–600 km s-1 (Koenigsberger et al. 1998; Koenigsberger 2004). Over the following years the wind accelerated and a fast-slow wind interaction region developed. Koenigsberger et al. (2001) noted the presence of discrete absorption components in UV spectra obtained in 1999 and 2000 which they attributed to this region. Thus, HD 5980 provides the unique opportunity to study in detail the mass-losing characteristics of LBV’s during their transitions from slow to fast wind phases.
In this paper we apply the model developed in Cantó et al. (2005) and González et al. (2006) to the 1994 eruption of HD 5980 in order to glean the formation process and subsequent evolution of its fast-slow wind interacting shell.
2. The dynamical model
Let us consider a stellar wind which initially is ejected with terminal velocity v1 and mass-loss rate ṁ1 from a central star of radius r0. The onset of the eruption phase is assumed to occur suddenly and during this phase, we assumed a slower velocity for the ejected material with terminal velocity v0 and a more massive ejecta with mass-loss rate ṁ0. This phase is followed by a stellar outflow with the same conditions of the original wind with v1 and ṁ1.
The eruption is assumed to begin at a time t = −(τ − Δτ), when the wind velocity decreases while the mass-loss rate increases. At t = 0, the original wind returns back to its original characteristics for a finite interval of time Δτ. Therefore, the total duration of the pulse is τ. In Fig. 2, we present a schematic diagram showing the behaviour of the adopted parameters of the interacting outflows.
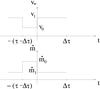 |
Fig. 2 Qualitative behaviour of the wind velocity vw and the mass-loss rate ṁ of the model described in Sect. 2 as functions of time. At a time t = −(τ − Δτ) the eruption begins when the wind velocity decreases while the mass-loss rate increases. At t = 0, the original wind resumes for an interval of time Δτ. The total duration of the pulse is τ. |
The interaction between the slow wind and the faster wind occurs immediately after the latter is “turned on” and results in the formation of a two-shock wave structure, called working surface (WS), whose location is initially at r0 and propagates outwards over time. It has been shown (e.g. Raga et al. 1990; Cantó et al. 2005; González et al. 2006) that there are two different phases in the dynamical evolution of the WS. Initially, it propagates with a constant velocity and it is bounded by two shock fronts within which the shocked material accumulates forming a shell. Once all of the slow wind has entered the WS, the outer shock disappears giving rise to the second phase of dynamical evolution in which the shell begins to accelerate as it is being fed by the fast wind behind it.
Let
a ( = v1/v0 > 1)
and
b ( = ṁ1/ṁ0 < 1)
be the change factors of the wind parameters. Using the formalism presented in Cantó et al.
(2000), it can be shown that during the constant
velocity phase the WS velocity vWS is given by  (1)with
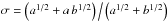 .
.
Consequently, after a time t since the ending of the eruption, the
distance of the working surface rWS from the central star is
simply 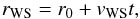 (2)where
we have assumed that the WS is thin enough to be described by a unique distance (see, also,
Gonzalez & Cantó 2002).
(2)where
we have assumed that the WS is thin enough to be described by a unique distance (see, also,
Gonzalez & Cantó 2002).
As mentioned above, the second phase begins when the slow wind is completely incorporated
into the WS. This occurs at a time tc given by  (3)From
Eqs. (1), (2), it follows that the transition occurs at a distance
rc ≃ σv0 tc
(where r0 ≪ rc).
(3)From
Eqs. (1), (2), it follows that the transition occurs at a distance
rc ≃ σv0 tc
(where r0 ≪ rc).
Subsequently, for t > tc, the WS is
accelerated by the fast wind, and the WS velocity is obtained by  (4)where
![Mathematical equation: \begin{eqnarray} \psi(t)= a - {{a-\sigma} \over{{[1 + \varsigma (t-t_{\rm c})]}^{1/2}}} \nonumber \end{eqnarray}](/articles/aa/full_html/2014/01/aa22980-13/aa22980-13-eq29.png) being
ς a constant defined by
being
ς a constant defined by  Note
from Eq. (4) that
vWS = σv0 for
t = tc, while
vWS → av0 for
t → ∞.
Note
from Eq. (4) that
vWS = σv0 for
t = tc, while
vWS → av0 for
t → ∞.
Integration of Eq. (4) gives the position of the shell during this second phase (see, González et al. 2006).
3. Input parameters for the 1994 event
The characteristics of HD 5980 and its 1994 eruption are described in Barbá et al. (1996), Drissen et al. (2001), Moffat et al. (1998), Koenigsberger et al. (1998, 2000), Koenigsberger (2004) and Georgiev et al. (2011). Here we will only highlight the aspects that are relevant to the present investigation.
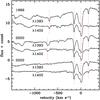 |
Fig. 3 Si IV lines at λ1393 and λ1402 observed with HST in 1999 and 2000 showing the absorption components formed in material that is approaching the observer at velocities of −684 (1999) and −715 (2002), speeds that correspond to the model presented in this paper. These components are no longer visible in 2002. Also indicated with vertical lines are the interstellar absorption components associated with the Galaxy and the SMC, as well as a line-of-sight supernova remnant. All plotted spectra correspond to orbital phase φ ~0. |
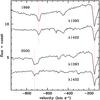 |
Fig. 4 Amplified portion of spectra shown in Fig. 3, illustrating the apparent splitting of the circumbinary component in 2000 and the presence of additional discrete absorptions at other speeds. The 1999 spectrum shown corresponds to orbital phase φ = 0.05. |
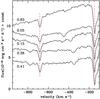 |
Fig. 5 Si IV 1393 Å component formed in material that is approaching the observer at 684 km s-1 in the five HST spectra obtained in 1999 covering the 19.3 d binary orbital cycle. Its stability over this timescale indicates that it is formed in circumbinary material, contrary to other absorption features that undergo velocity shifts from one orbital phase to another. Orbital phases are indicated and time of observation increases downward. |
HD 5980 is a multiple system that contains a 19.3 d eclipsing binary, Star A + Star B, and a third object, Star C. Monitoring at UV wavelengths during the 1980 s and early 1990 s disclosed a systematic trend of declining wind speed while at the same time a brightening of the system was detected (Koenigsberger et al. 1994). The system was announced to have entered into an eruptive phase in early 1994 (Bateson et al. 1994; Bateson & Jones 1994) undergoing a sudden brightening by ~3 mag in the visual. The erupting star was subsequently identified with the Star A component (Barbá et al. 1996).
Observations obtained with the Hubble Space Telescope (HST) in 1999 and 2000 were used to perform an analysis of the interstellar absorption components along the line-of-sight to HD 5980 (Koenigsberger et al. 2001). In addition to the narrow absorption components corresponding to the Galaxy, the SMC and a line-of-sight supernova remnant, a set of discrete absorptions was discovered at a velocity1 of − 684 ± 4 km s-1 in the five spectra obtained over a 15-day timespan starting in 1999 that were associated by Koenigsberger et al. (2001) with the fast-slow wind interaction region. The different velocity systems are indicated in Fig. 3 with vertical lines. Figure 4 shows amplified portions of the 1999 and 2000 spectra. It is important to note that the −684 km s-1 absorption is stationary over the 19.3 d binary orbital cycle, indicating that it is formed well beyond the orbital radius (~150 R⊙). The other absorptions present in Fig. 3 are not stationary on this timescale, as shown in Fig. 5, where the 5 spectra of 1999 are plotted in order of increasing time. The possible source of the orbital phase-dependent features will be addressed in Sect. 5.
The sixth spectrum of the original HST program was obtained on 2000 April 20 and it showed the appearance of a new component at a velocity of −723 ± 4 km s-1 in the direction of the observer. None of the discrete components were present when the system was re-observed in 2002.
The observed visual magnitude (mv) brightening
around the time of the 1994 eruption was associated with a significant drop in wind speed
(V∞) and an increase in mass-loss rate. Based on the analysis
presented in Georgiev et al. (2011), we set the fast
wind velocity v1 = 1600 km s-1, the mass-loss rates
 yr-1 and
 yr-1, and
constrained v0 = 200–400 km s-1. We arrived at a
final value v0 = 320 km s-1 by comparing the
speed of the WS that is predicted by our model with the HST observations of 1999 and
20002.
yr-1, and
constrained v0 = 200–400 km s-1. We arrived at a
final value v0 = 320 km s-1 by comparing the
speed of the WS that is predicted by our model with the HST observations of 1999 and
20002.
The visual magnitude light curve obtained by A. F. Jones (Fig. 1) served as a guide for setting the relevant timescales of the event: for the date of the transition from the fast to the slow wind phase, we adopted − (τ − Δτ) = 1994.4, and t0 = 1995.1 for the start of the subsequent fast-wind phase, and we assumed that this latter phase lasted a time Δτ = 5.8 yr. With the adopted velocity and mass-loss values, a = 5.0 and b = 0.1. Table 1 summarizes the input parameters.
Note that there was a precursor eruptive event in 1993, of significantly smaller scale, which most likely involved a transition of fast-slow-fast winds. However, the interacting winds shell formed during this event was also of significantly smaller scale and would be expanding faster than the new WS associated with the 1994 eruption, and would therefore be of no consequence for the calculation.
4. Results
In Fig. 6, we present the evolution over time of the WS velocity and its distance from the central star as predicted by the model. In this figure, t = 0 corresponds to the start of the fast-wind phase, 1995.1. During the constant velocity phase, for t ≤ tc with tc = 1.4 yr (i.e., between 1995.1 and 1996.5), the WS advances through the slow wind shell at a speed of 479 km s-1 which is intermediate between the fast wind and the slower ejecta. In 1996.5, the second dynamical phase begins, when the WS accelerates asymptotically approaching the speed of the the post-outburst wind (v1). We also note from the figure that after 4.25 yr of the dynamical evolution of the WS (in 1999.35), our model predicts a WS velocity of vWS = 683.7 km s-1, while at t = 5.20 yr (in 2000.30), vWS = 730.8 km s-1. These values are consistent with velocities of the fast absorption components observed in the HST spectra at these epochs, − 684 ± 4 km s-1 and − 723 ± 4 km s-1, respectively shown in Fig. 3.
5. Discussion
Mass-loss during the LBV phase of massive stars is a crucial ingredient in defining the subsequent evolutionary path that is ultimately followed and which ends in the supernova event (Langer 2012). In particular, the manner in which this mass-loss occurs can serve as a diagnostic for the processes driving the instability causing the eruptive events. Most LBVs have circumstellar structures, but in very few can these be associated with a particular eruption and, to our knowledge, none has ever been observed during its formation stage.
Adopted parameters for the model computation.
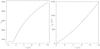 |
Fig. 6 Predicted speed vWS (left) and radial distance rWS (right) of the internal WS formed from the interaction between the fast post-eruption stellar wind (1600 km s-1) with the slower eruption-phase wind (320 km s-1). Time t = 0 corresponds to the end of the slow-wind phase and is assumed to occur on 1995.1. As the WS advances through the slower wind, it initially travels at a constant speed of 479 km s-1. After the critical time tc ≃ 1.4 yr, the WS is accelerated asymptotically approaching the fast wind velocity. |
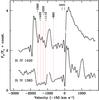 |
Fig. 7 Structure of the Si IV 1393, 1402 Å lines observed in IUE spectrum SWP 52888 obtained on 1994 Nov. 23. The vertical dotted lines indicate the location of apparent high velocity absorption features formed in the “fossil” wind emitted prior to the eruption. |
HD 5980 initiated an unstable state in the mid-1980 s which intensified in mid-1994 causing an abrupt transition in its wind from a fast and relatively low-density structure to a slow and dense outflow. Seven months later, the cause of the growth in the instability had subsided, the slow-wind phase ended, and when the fast wind “turned on”, it collided with and started sweeping up the slow-moving shell in front of it. According to our model, the WS of this interaction zone advanced at constant speed during 1.4 yr and then initiated its accelerated expansion phase. Our observations record it as moving at 684 km s-1 in 1999 and 39 km s-1 faster one year later, in 2000. These speeds are consistent with model input parameters as listed in Table 1. Thus, we conclude that we have witnessed for the first time the earliest stages in the formation of an interstellar shell around an LBV.
It is interesting that the model presented above matches the observations so well considering that it is a simplified scenario for the actual transition phases of the wind in HD 5980. For example, the changes in the wind velocity from v1 = 1600 km s-1 to v0 = 230 km s-1 and back again to v1 were not instantaneous as assumed in the model, but consisted of a series of jumps to systematically smaller wind speeds. This can be seen in the structure of the Si IV 1393, 1402 P Cygni lines observed with IUE in 1994 November (Fig. 7). Although this spectrum was obtained well into the descending branch of the light curve, several discrete absorption components produced in the pre-eruption (“fossil”) wind are evident in the range −1110 to −1590 km s-1. These discrete absorptions can be interpreted to correspond to discrete jumps to systematically slower wind velocities that occurred during the onset of the eruption; i.e., during the ascending branch of the light curve.
Similar jumps occurring during the descending phase of the light curve, if present, are not expected to be visible since in this case each jump involves a velocity increase and the faster moving shells would very quickly overtake the slower moving flows. Clearly, however, the transition from the slow v0 wind to the fast v1 flow was rapid enough so that the instantaneous approximation seems to be applicable.
A second effect that is not taken into account in our model is the presence of the close binary companion whose own wind and radiation field are expected to influence the dynamics of the flow in its vicinity. However, the momentum of the companion’s wind became significant only several years after the eruption. We speculate that the effects produced by this companion could be the origin of the phase-dependent narrow features observed in the 1999 spectra (Fig. 5), which, however, are expected to be more localized and short-lived than those caused by a global transition from a slow to a fast wind in all directions.
Finally, it is interesting to note that the LBV component in HD 5980 still contains a significant amount of hydrogen on its surface and that its basic properties are not known to have changed significantly with respect to those prior to the 1994 eruption. Hence, the underlying instability that led up to the eruption may still be present, implying that future eruptive events may be expected.
All velocities quoted here refer to a reference frame centered on the systemic SMC velocity in the region where HD 5980 lies of +150 km s-1 with respect to the laboratory wavelength of the atomic transitions that are measured.
Note that the wind velocity determination for a spectrum obtained in 1994.75, after the maximum in the eruption, is given by Heydari-Malayeri et al. (1997) V∞ = 375 km s-1.
Acknowledgments
This work was supported by CONACYT grant IN 129343 and UNAM/PAPIIT grants IN100511 and 105313. The authors acknowledge Jorge Canto for his comments.
References
- Barbá, R. H., Morrell, N. I., Niemela, V. S., et al. 1996, Rev. Mex. Astron. Astrofis. Ser. Conf., 5, 85 [NASA ADS] [Google Scholar]
- Bateson, F. M., Gilmore, A., & Jones, A. F. 1994a, IAU Circ., 6102 [Google Scholar]
- Bateson, F. M., & Jones, A. 1994b, Publ. Var. Star. Sec. R. Astron. Soc. New Zealand, 19, 50 [Google Scholar]
- Cantó, J., Raga, A., & D’Alessio, P. 2000, MNRAS, 313, 656 [NASA ADS] [CrossRef] [Google Scholar]
- Cantó, J., González, R. F., Raga, A. C., et al. 2005, MNRAS, 357, 572 [NASA ADS] [CrossRef] [Google Scholar]
- Drissen, L., Crowther, P. A., Smith, L. J., et al. 2001, ApJ, 546, 484 [NASA ADS] [CrossRef] [Google Scholar]
- Frank, A., Balick, B., & Davidson, K. 1995, ApJ, 441, 77 [Google Scholar]
- García-Segura, G., Langer, N., & MacLow, M.-M. 1996, A&A, 316, 133 [NASA ADS] [Google Scholar]
- Georgiev, L., Koenigsberger, G., Hillier, D. J., et al. 2011, AJ, 142, 191 [NASA ADS] [CrossRef] [Google Scholar]
- González, R. F., & Cantó, J. 2002, ApJ, 580, 459 [NASA ADS] [CrossRef] [Google Scholar]
- González, R. F., Gouveia Dal Pino, E. M., Raga, A. C., & Velázquez, P. F. 2004a, ApJ, 600, L59 [NASA ADS] [CrossRef] [Google Scholar]
- González, R. F., Gouveia Dal Pino, E. M., Raga, A. C., & Velázquez, P. F. 2004b, ApJ, 616, 976 [NASA ADS] [CrossRef] [Google Scholar]
- González, R. F., Montes, G., Cantó, J., & Loinard, L. 2006, MNRAS, 373, 391 [NASA ADS] [CrossRef] [Google Scholar]
- González, R. F., Villa, A. M., Gómez, G. C., et al. 2010, MNRAS, 402, 1141 [NASA ADS] [CrossRef] [Google Scholar]
- Heydari-Malayeri, M., Rauw, G., Esslinger, O., & Beuzit, J.-L. 1997, A&A, 322, 554 [NASA ADS] [Google Scholar]
- Koenigsberger, G. 2004, Rev. Mex. Astron. Astrofis., 40, 107 [Google Scholar]
- Koenigsberger, G., Moffat, A. F. J., St. Louis, N., et al. 1994, ApJ, 436, 301 [NASA ADS] [CrossRef] [Google Scholar]
- Koenigsberger, G., Auer, L. H., Georgiev, L., & Guinan, E. 1998, ApJ, 496, 934 [NASA ADS] [CrossRef] [Google Scholar]
- Koenigsberger, G., Georgiev, L., Barbá, R., et al. 2000, ApJ, 542, 428 [NASA ADS] [CrossRef] [Google Scholar]
- Koenigsberger, G., Georgiev, L., Peimbert, M., et al. 2001, AJ, 121, 267 [NASA ADS] [CrossRef] [Google Scholar]
- Koenigsberger, G., Fullerton, A., Massa, D., & Auer, L. H. 2006, AJ, 132, 1527 [NASA ADS] [CrossRef] [Google Scholar]
- Langer, N. 2012, ARA&A, 50, 10 [Google Scholar]
- Langer, N., Hamann, W.-R., Lennon, M., et al. 1994, A&A, 290, 819 [NASA ADS] [Google Scholar]
- Maeder, A., & Meynet, G. 1987, A&A, 182, 243 [NASA ADS] [Google Scholar]
- Moffat, A. F. J., Marchenko, S. V., Bartzakos, P., et al. 1998, ApJ, 497, 896 [NASA ADS] [CrossRef] [Google Scholar]
- Raga, A. C., Cantó, J., Binette, L., & Calvet, N. 1990, ApJ, 364, 601 [NASA ADS] [CrossRef] [Google Scholar]
- Vink, J. S. 2012, in Eta Car and the hypernova impostors, eds. R. Humphries, & K. Davidson, Astrophys. Space Sci. Lib., 384, 221 [Google Scholar]
All Tables
All Figures
|
Fig. 1 Eye-estimates of the visual magnitude obtained by A. F. Jones (priv. comm.) covering the time of the 1993–1994 eruptive events. Here we plot only data corresponding to orbital phases out of eclipse, and a correction of +0.6 mag was applied to the original data to make it compatible with photometric determinations. The dash lines mark the times that are used as input parameters for the interacting wind model described in Sect. 2. |
| In the text | |
|
Fig. 2 Qualitative behaviour of the wind velocity vw and the mass-loss rate ṁ of the model described in Sect. 2 as functions of time. At a time t = −(τ − Δτ) the eruption begins when the wind velocity decreases while the mass-loss rate increases. At t = 0, the original wind resumes for an interval of time Δτ. The total duration of the pulse is τ. |
| In the text | |
|
Fig. 3 Si IV lines at λ1393 and λ1402 observed with HST in 1999 and 2000 showing the absorption components formed in material that is approaching the observer at velocities of −684 (1999) and −715 (2002), speeds that correspond to the model presented in this paper. These components are no longer visible in 2002. Also indicated with vertical lines are the interstellar absorption components associated with the Galaxy and the SMC, as well as a line-of-sight supernova remnant. All plotted spectra correspond to orbital phase φ ~0. |
| In the text | |
|
Fig. 4 Amplified portion of spectra shown in Fig. 3, illustrating the apparent splitting of the circumbinary component in 2000 and the presence of additional discrete absorptions at other speeds. The 1999 spectrum shown corresponds to orbital phase φ = 0.05. |
| In the text | |
|
Fig. 5 Si IV 1393 Å component formed in material that is approaching the observer at 684 km s-1 in the five HST spectra obtained in 1999 covering the 19.3 d binary orbital cycle. Its stability over this timescale indicates that it is formed in circumbinary material, contrary to other absorption features that undergo velocity shifts from one orbital phase to another. Orbital phases are indicated and time of observation increases downward. |
| In the text | |
|
Fig. 6 Predicted speed vWS (left) and radial distance rWS (right) of the internal WS formed from the interaction between the fast post-eruption stellar wind (1600 km s-1) with the slower eruption-phase wind (320 km s-1). Time t = 0 corresponds to the end of the slow-wind phase and is assumed to occur on 1995.1. As the WS advances through the slower wind, it initially travels at a constant speed of 479 km s-1. After the critical time tc ≃ 1.4 yr, the WS is accelerated asymptotically approaching the fast wind velocity. |
| In the text | |
|
Fig. 7 Structure of the Si IV 1393, 1402 Å lines observed in IUE spectrum SWP 52888 obtained on 1994 Nov. 23. The vertical dotted lines indicate the location of apparent high velocity absorption features formed in the “fossil” wind emitted prior to the eruption. |
| In the text | |
Current usage metrics show cumulative count of Article Views (full-text article views including HTML views, PDF and ePub downloads, according to the available data) and Abstracts Views on Vision4Press platform.
Data correspond to usage on the plateform after 2015. The current usage metrics is available 48-96 hours after online publication and is updated daily on week days.
Initial download of the metrics may take a while.