Fig. 1
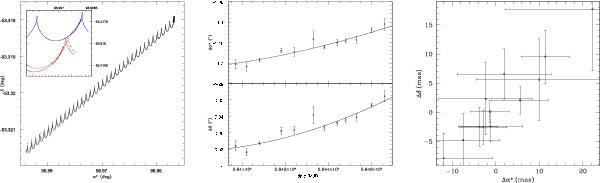
Left: old and new observations adjusted. The dotted line represents the solution based upon Luhman (2013) and Mamajek (2013). The black continuous line represents the motion of the barycentre from our solution. The inset zooms onto the region covered by the FORS2 observations. The red (resp. blue) line represents the motion of the L (resp. T) dwarf. Middle: relative positions obtained with FORS2 during our two-month monitoring campaign and the best parabolic fits. Right: residuals of the FORS2 data based on the parabolic fit.
Current usage metrics show cumulative count of Article Views (full-text article views including HTML views, PDF and ePub downloads, according to the available data) and Abstracts Views on Vision4Press platform.
Data correspond to usage on the plateform after 2015. The current usage metrics is available 48-96 hours after online publication and is updated daily on week days.
Initial download of the metrics may take a while.