| Issue |
A&A
Volume 561, January 2014
|
|
|---|---|---|
| Article Number | A132 | |
| Number of page(s) | 5 | |
| Section | The Sun | |
| DOI | https://doi.org/10.1051/0004-6361/201322879 | |
| Published online | 22 January 2014 | |
No evidence for planetary influence on solar activity 330 000 years ago
1 Laboratoire des Sciences du Climat et de l’Environnement (LSCE), Ormes des Merisiers, 91191 Gif-sur-Yvette, France
e-mail: This email address is being protected from spambots. You need JavaScript enabled to view it.
2 Centre de Sciences Nucléaires et de Sciences de la Matière (CSNSM), UMR CNRS 8609, Université Paris Sud XI, Bât 108, 91405 Orsay, France
3 Aix-Marseille Université, CNRS-IRD-Collège de France, UM 34 CEREGE, Technopôle de l’Environnement Arbois-Méditerranée, BP80, 13545 Aix-en-Provence, France
Received: 21 October 2013
Accepted: 18 November 2013
Abstract
Context. Abreu et al. (2012, A&A. 548, A88) have recently compared the periodicities in a 14C – 10Be proxy record of solar variability during the Holocene and found a strong similarity with the periodicities predicted on the basis of a model of the time-dependent torque exerted by the planets on the sun’s tachocline. If verified, this effect would represent a dramatic advance not only in the basic understanding of the Sun’s variable activity, but also in the potential influence of this variability on the Earth’s climate. Cameron and Schussler (2013, A&A. 557, A83) have seriously criticized the statistical treatment used by Abreu et al. to test the significance of the coincidences between the periodicities of their model with the Holocene proxy record.
Aims. If the Abreu et al. hypothesis is correct, it should be possible to find the same periodicities in the records of cosmogenic nuclides at earlier times.
Methods. We present here a high-resolution record of 10Be in the EPICA Dome C (EDC) ice core from Antarctica during the Marine Interglacial Stage 9.3 (MIS 9.3), 325–336 kyr ago, and investigate its spectral properties.
Results. We find very limited similarity with the periodicities seen in the proxy record of solar variability during the Holocene, or with that of the model of Abreu et al.
Conclusions. We find no support for the hypothesis of a planetary influence on solar activity, and raise the question of whether the centennial periodicities of solar activity observed during the Holocene are representative of solar activity variability in general.
Key words: Sun: activity / Sun: magnetic fields / sunspots / dynamo / solar-terrestrial relations / planet-star interactions
Present address: Laboratoire de Météorologie Dynamique (LMD), Université Paris 6, Tour 45–55, 75252 Paris Cedex 05, France.
M. Arnold, G. Aumaître, D. L. Bourlès and K. Keddadouche.
© ESO, 2014
1. Introduction
While the basic source of solar activity is believed to be a self-sustaining dynamo, details regarding its variability remain largely a mystery (Charbonneau 2010). In addition to the well-established 11-year sunspot cycle, there have been claims of a number of other periodicities, including 88 years (Gleissberg), 210 years (de Vries), Eddy (970 years), Hallstatt (2300 years), and other unnamed centennial cycles (Abreu et al. 2012, and references therein). While initially the evidence for most of these was also based on sunspot data, the use of cosmogenic nuclide records, in particular 14C in tree rings and 10Be in ice cores, has become increasingly prevalent. This is based on the fact that perturbations of the magnetic field associated with the outflowing solar wind deflect and reduce in energy the galactic cosmic rays reaching the Earth’s atmosphere, and thus the production of these cosmogenic nuclides (Usoskin 2013). The fact that 14C tree ring records can go back several tens of thousands of years, and 10Be records several hundreds of thousands, provides the possibility of studying solar variability over much longer periods than are available with sunspot data.
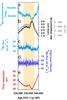 |
Fig. 1 a)10Be concentration; b) δD and ice accumulation rate; c)10Be flux; d) 2000-year high-band passed 10Be flux; and e) 10Be sample resolution in EDC ice core. |
One of the most recent and best established cosmogenic nuclide records is a principal component analysis of a composite of several 14C and 10Be series during the Holocene period (Steinhilber et al. 2012). Abreu et al. (2012) have compared the periodicities in this record with those based on a model of the time-dependent torque exerted by the planets on the Sun’s tachocline. They find good agreement with five of these periodicities, which they estimate has a chance occurrence of less than one in a million. If verified, this effect would represent a dramatic advance in the basic understanding of the Sun’s variable activity, and also of the potential influence of this variability on the Earth’s climate. It is therefore not surprising that this hypothesis has been described as a possible major scientific discovery (Charbonneau 2013).
Cameron & Schüssler (2013) and Poluianov & Usoskin (2014) have seriously criticized the statistical treatment used by Abreu et al. (2012) to test the significance of the coincidences between the periodicities of their model with the Holocene proxy record. Here we address the question of how representative the Steinhilber et al. (2012) Holocene record is for solar activity variability in general.
If the hypothesis of Abreu et al. is correct, it should be possible to find the same periodicities in the records of cosmogenic nuclides at earlier times. As mentioned above, 10Be in ice cores can be measured over several hundred thousand years in the past. We look here at the record of 10Be in the EPICA (European Project for Ice Coring in Antarctica) Dome C (EDC) ice core from Antarctica during the Marine Interglacial Stage 9.3 (MIS 9.3), 325–336 kyr ago. This record is part of a data set between 269–355 kyr that was produced (Cauquoin 2013) in the framework of a project to measure a continuous high-resolution profile in the EDC core over the past 800 kyr. Other data from this project are being published separately. The resolution of our measurements between 325–336 kyr (20–29 yr) is comparable to that (resampled at 22 yr) used by Abreu et al. (2012), and allows us to investigate all five of the periodicities cited by them.
2. Methods and results
The experimental procedures for sample preparation and measurement are summarized in Cauquoin (2013). In Fig. 1 we show the 10Be concentration and the resolution of the measurements for the period 320–340 kyr before present. It has been found that, at least for low ice accumulation rate locations on the Antarctic plateau where dry deposition dominates, the 10Be flux is more constant than 10Be concentration (Raisbeck & Yiou 1985; Yiou et al. 1985; Delaygue & Bard 2011). Thus, we also show in Fig. 1 the estimated ice accumulation rate based on the deuterium profile (Parrenin et al. 2007b), and the resulting 10Be flux. As can be seen, the flux is indeed more constant than the concentration. Nevertheless, there still remain some low frequency variations, shown as the bold curve in Fig. 1c, which might result from millennial scale changes in geomagnetic field intensity or climate. Since we are mainly interested here in centennial variations, we study the data after high-pass filtering (rectangular cutoff frequency at 1/2000 yr-1). A similar filter has been used by Steinhilber et al. (2012) in constructing the solar modulation parameter used by Abreu et al. (2012) as their solar activity proxy. The result is shown as Fig. 1d, which are the data that are used for the spectral analyses discussed below.
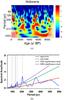 |
Fig. 2 a) Wavelet and b) Fourier analyses of the composite from Steinhilber et al. (2012) during the Holocene. |
In what follows, for wavelet analyses we have used the MATLAB package of Grinsted et al. (2004) and for Fourier analyses the REDFIT program of Schulz & Mudelsee (2002). The latter allows one to calculate the spectra of unevenly spaced time series and to obtain an accurate estimate of their red-noise spectra.
To confirm that our analysis procedure is consistent with that used by Abreu et al. (2012), we first show in Fig. 2 the wavelet and Fourier analyses of the Holocene cosmogenic principal composite record of Steinhilber et al., kindly provided by J. Beer (priv. comm.). Our wavelet analysis appears identical to their Fig. 1. We note that in our figure time is plotted running to the right, while in that of Abreu et al. (2012) it runs to the left. For our Fourier spectrum, we find significant (>99%) peaks at four of the five periodicities (88, 104, 150, and 208 years) cited by Abreu et al. (2012) as being common to those found in their planetary torque model. For the cycle at 506 years, however, we find it is consistent with red noise. We also find peaks at 130 years (>99%) and 350 years (95%). Unfortunately, Abreu et al. do not show significance levels in their Fig. 5, so it is difficult for us to make a quantitative comparison. As can be seen from the wavelet analyses, all the periodicities are intermittent, as also found by Abreu et al. (2012).
In Fig. 3 we show the same procedures applied to our 10Be flux for the period 325–336 kyr. For the Fourier spectrum, we find only one highly significant (>99%) peak having the same periodicity (104 years) cited by Abreu et al. (2012) There is also a modestly significant peak (~95%) at 150 years. The other frequencies cited by Abreu et al. (2012), at 88, 208, and 506 years, all have a significance of <95%, and appear consistent with red noise.
The most significant periodicity in our record is at 130 years. Interestingly, a 130 year periodicity is also seen in the Fourier spectrum of Abreu et al., but not in the spectrum of the planetary torque. While the wavelet spectrum shows isolated periodicities at ~500 and 1000 years, they are only about one cycle long, and therefore not considered significant.
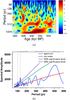 |
Fig. 3 a) Wavelet and b) Fourier analyses of our 10Be flux record at EDC during the interglacial period MIS 9.3 (325–336 kyr). |
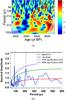 |
Fig. 4 a) Wavelet and b) Fourier analyses of the Steinhilber et al. (2012)10Be record at EDML from 9400 to 1255 BP. |
3. Discussion
There are several possible explanations for why we do not find the same periodicities as those found by Abreu et al. (2012) for the Holocene. One is that we use 10Be flux rather than 10Be concentration. While, as mentioned above, we believe that flux is a better indicator of 10Be production, at least for the Antarctic plateau, Abreu et al. have used concentrations for their analyses (a calculation of fluxes requires a theoretical estimate of ice accumulation rate in addition to the measured 10Be concentrations). Therefore, we show in Fig. A.1 our analysis of the EDC data using concentrations. The results are very similar. Thus, we do not think that the use of flux explains why we do not find the periodicities of Abreu et al. A second possibility is that our chronology for the 325–336 kyr time period is not accurate. To investigate this, we first did the same analysis using the new AICC2012 (Antarctic Ice Core Chronology 2012) chronology for EDC (Bazin et al. 2013). The results (Fig. A.2) are very similar. We then tried a chronology (DFGT (Dome Fuji Glaciological Timescale), Parrenin et al. 2007a) derived from the chronology of Kawamura et al. (2007) based on orbital tuning of the N2/O2 ratio in the Dome F core, which itself is tightly correlated with EDC. With this chronology we see that the previously observed periodicities at 104 and 130 years are increased to 120 and ~150 years (Fig. A.3). However, we still do not find the periodicities cited by Abreu et al. (2012). Therefore, while we recognize that our chronology is not as robust as that used by Steinhilber et al. for the Holocene, we do not think this is an explanation for the absence in our data of periodicities corresponding to those of Abreu et al.
Finally, the main difference between the analyses of Abreu et al. and ours, is that they use a composite 14C – 10Be record representing both hemispheres, while we use a single 10Be record from the Antarctic. To test the possible influence of this, we show in Fig. 4 an analysis done using the 10Be concentration (resampled at 22 years and high-pass filtered at 2000 years) from the EPICA Dronning Maud Land (EDML) core (again provided by J. Beer), which is the only Antarctic record in the composite of Steinhilber et al. (2012) covering the period between 9400−1255 before present. Here we find that the only significant periodicities are those of 87 years (99%) and 210 years (95%). Thus, the fact that we are using only a single 10Be record may partially explain why we do not find all the periodicities of Abreu et al. However, the fact that we do not even find the ~208 year de Vries periodicity, which after the 11-year cycle, is probably the most prominent solar cycle during the Holocene, must raise a certain doubt regarding the hypothesized planetary model proposed by Abreu et al. (2012) It also calls into question whether the solar variability periodicities observed during the Holocene are representative of solar activity in general.
4. Conclusion
To test the hypothesis of Abreu et al. (2012) that there is a planetary influence on solar variability, we have investigated the spectral properties of a high-resolution 10Be record in an Antarctic ice core during the period 325–336 kyr BP. We find very limited similarity between the periodicities in this record compared to those found in a proxy record of solar variability during the Holocene, or those predicted by the model of Abreu et al. Since our record is only of a single nuclide from one core, we cannot definitively exclude the hypothesis of Abreu et al. Our results do suggest however, that it is important to test other proxy records of solar variability for times other than the Holocene. If observed periodicities in variability are not constant and stationary over time, this would rule out that any regular forcing factor, such as planetary positions, has a significant influence on solar activity.
Acknowledgments
We acknowledge the referee for his useful comments on this manuscript. We thank Jacques Laskar, Didier Paillard and Pascal Yiou for helpful discussions, and Juerg Beer who kindly provided the composite record and the EDML 10Be profile from Steinhilber et al. (2012).
References
- Abreu, J. A., Beer, J., Ferriz-Mas, A., McCracken, K. G., & Steinhilber, F. 2012, A&A, 548, A88 [NASA ADS] [CrossRef] [EDP Sciences] [Google Scholar]
- Bazin, L., Landais, A., Lemieux-Dudon, B., et al. 2013, Climate of the Past, 9, 1715 [Google Scholar]
- Cameron, R. H., & Schüssler, M. 2013, A&A, 557, A83 [NASA ADS] [CrossRef] [EDP Sciences] [Google Scholar]
- Cauquoin, A. 2013, Ph.D. Thesis, Université Paris-Sud 11, France [Google Scholar]
- Charbonneau, P. 2010, Liv. Rev. Sol. Phys., 7, 3 [Google Scholar]
- Charbonneau, P. 2013, Nature, 493, 613 [NASA ADS] [CrossRef] [PubMed] [Google Scholar]
- Delaygue, G., & Bard, E. 2011, Clim. Dyn., 36, 2201 [Google Scholar]
- Grinsted, A., Moore, J. C., & Jevrejeva, S. 2004, Nonlin. Proc. Geophys., 11, 561 [Google Scholar]
- Kawamura, K., Parrenin, F., Lisiecki, L., et al. 2007, Nature, 448, 912 [NASA ADS] [CrossRef] [PubMed] [Google Scholar]
- Parrenin, F., Dreyfus, G., Durand, G., et al. 2007a, Climate of the Past, 3, 243 [NASA ADS] [CrossRef] [Google Scholar]
- Parrenin, F., Barnola, J.-M., Blunier, T., et al. 2007b, Climate of the Past, 3, 485 [NASA ADS] [CrossRef] [Google Scholar]
- Poluianov, S., & Usoskin, I. G. 2014, Sol. Phys., accepted [Google Scholar]
- Raisbeck, G. M., & Yiou, F. 1985, Ann. Glaciol., 7, 138 [NASA ADS] [Google Scholar]
- Schulz, M., & Mudelsee, M. 2002, Comput. Geosci., 28, 421 [NASA ADS] [CrossRef] [Google Scholar]
- Steinhilber, F., Abreu, J. A., Beer, J., et al. 2012, Proc. National Academy of Science, 109, 5967 [Google Scholar]
- Usoskin, I. G. 2013, Liv. Rev. Sol. Phys., 10, 1 [Google Scholar]
- Yiou, F., Raisbeck, G. M., Bourles, D., Lorius, C., & Barkov, N. I. 1985, Nature, 316, 616 [NASA ADS] [CrossRef] [Google Scholar]
Appendix A: 10Be concentrations and alternate chronologies
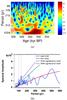 |
Fig. A.1 a) Wavelet and b) Fourier analyses of our 10Be concentration profile during MIS 9.3. |
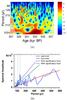 |
Fig. A.2 a) Wavelet and b) Fourier analyses of our 10Be concentration profile at EDC during MIS 9.3 using AICC2012 chronology. |
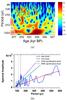 |
Fig. A.3 a) Wavelet and b) Fourier analyses our 10Be concentration profile at EDC during MIS 9.3 using DFGT chronology. |
All Figures
|
Fig. 1 a)10Be concentration; b) δD and ice accumulation rate; c)10Be flux; d) 2000-year high-band passed 10Be flux; and e) 10Be sample resolution in EDC ice core. |
| In the text | |
|
Fig. 2 a) Wavelet and b) Fourier analyses of the composite from Steinhilber et al. (2012) during the Holocene. |
| In the text | |
|
Fig. 3 a) Wavelet and b) Fourier analyses of our 10Be flux record at EDC during the interglacial period MIS 9.3 (325–336 kyr). |
| In the text | |
|
Fig. 4 a) Wavelet and b) Fourier analyses of the Steinhilber et al. (2012)10Be record at EDML from 9400 to 1255 BP. |
| In the text | |
|
Fig. A.1 a) Wavelet and b) Fourier analyses of our 10Be concentration profile during MIS 9.3. |
| In the text | |
|
Fig. A.2 a) Wavelet and b) Fourier analyses of our 10Be concentration profile at EDC during MIS 9.3 using AICC2012 chronology. |
| In the text | |
|
Fig. A.3 a) Wavelet and b) Fourier analyses our 10Be concentration profile at EDC during MIS 9.3 using DFGT chronology. |
| In the text | |
Current usage metrics show cumulative count of Article Views (full-text article views including HTML views, PDF and ePub downloads, according to the available data) and Abstracts Views on Vision4Press platform.
Data correspond to usage on the plateform after 2015. The current usage metrics is available 48-96 hours after online publication and is updated daily on week days.
Initial download of the metrics may take a while.