Fig. 7
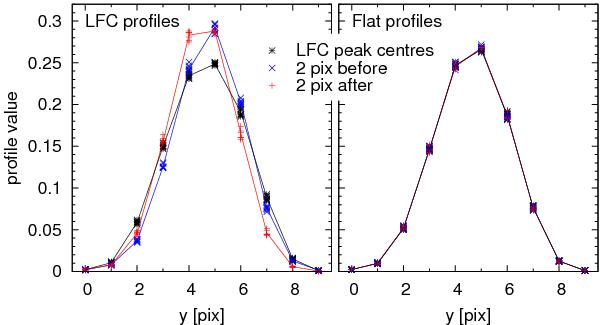
Cross-sections at different positions in the laser frequency comb spectrum and flat-field image. The cut positions are at the LFC peak maximum (black asterisks), two pixels before (blue crosses), and two pixels after (red plus), as indicated by the corresponding colored ticks in Fig. 6; the coloured lines connect the corresponding profile means. The profiles are normalised to unit area.
Current usage metrics show cumulative count of Article Views (full-text article views including HTML views, PDF and ePub downloads, according to the available data) and Abstracts Views on Vision4Press platform.
Data correspond to usage on the plateform after 2015. The current usage metrics is available 48-96 hours after online publication and is updated daily on week days.
Initial download of the metrics may take a while.