Free Access
Fig. 6
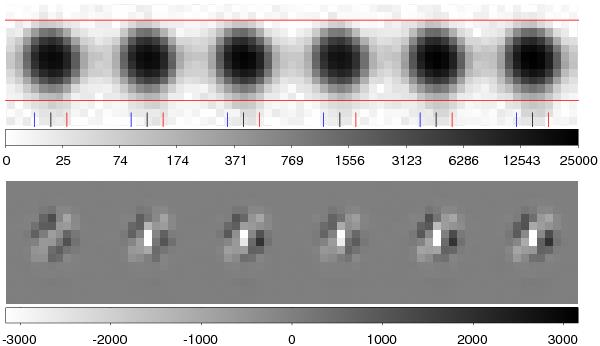
Section of a HARPS laser frequency spectrum Sx,y (top, logarithmic intensity scale) and residuals Sx,y − Ŝx,y after the FOX extraction (bottom, linear scale). Coloured ticks indicate positions of cross-section cuts (see Fig. 7).
Current usage metrics show cumulative count of Article Views (full-text article views including HTML views, PDF and ePub downloads, according to the available data) and Abstracts Views on Vision4Press platform.
Data correspond to usage on the plateform after 2015. The current usage metrics is available 48-96 hours after online publication and is updated daily on week days.
Initial download of the metrics may take a while.