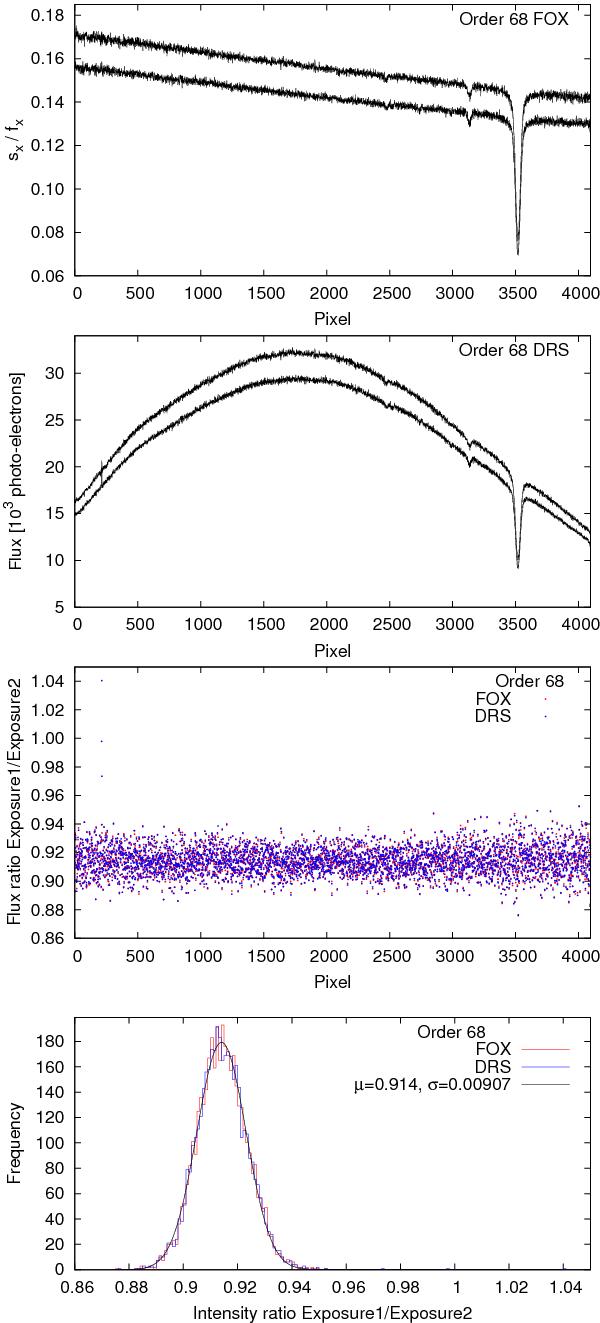
Fig. 3

Comparison of the extraction quality for two HARPS spectra of the B3IV star HD 60753 taken in the same night (S / N ~ 170). Top: extraction with FOX. Second panel: spectrum extracted with the HARPS DRS pipeline (not blaze corrected). Third panel: ratio of both exposures for FOX (red dots) and DRS (blue dots). Bottom: histogram of the ratio values. The black line is a Gaussian fit to the FOX histogram having a centre at 0.914 and a width of 0.00905.
Current usage metrics show cumulative count of Article Views (full-text article views including HTML views, PDF and ePub downloads, according to the available data) and Abstracts Views on Vision4Press platform.
Data correspond to usage on the plateform after 2015. The current usage metrics is available 48-96 hours after online publication and is updated daily on week days.
Initial download of the metrics may take a while.


