Fig. 1
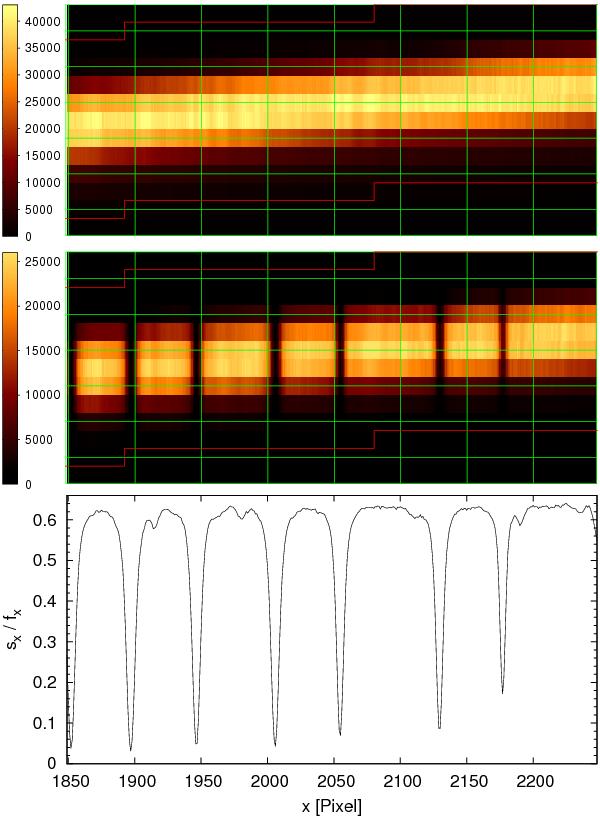
Principle of flat-relative optimal extraction (FOX). Each of the two upper panels shows a 400 pix × 13 pix section of the reddest HARPS order (fibre A). Pixel-to-pixel variations, fringing, order tilt/curvature, and the spatial profile are present in both the master flat Fx,y (top) and the stellar raw spectrum Sx,y which has additional (telluric) absorption lines (middle). The extracted spectrum sx / fx (bottom) is the scaling factor between both spectra for each column within the extraction mask (red lines).
Current usage metrics show cumulative count of Article Views (full-text article views including HTML views, PDF and ePub downloads, according to the available data) and Abstracts Views on Vision4Press platform.
Data correspond to usage on the plateform after 2015. The current usage metrics is available 48-96 hours after online publication and is updated daily on week days.
Initial download of the metrics may take a while.