| Issue |
A&A
Volume 561, January 2014
|
|
|---|---|---|
| Article Number | A121 | |
| Number of page(s) | 10 | |
| Section | Stellar structure and evolution | |
| DOI | https://doi.org/10.1051/0004-6361/201322662 | |
| Published online | 21 January 2014 | |
XMM-Newton observations of the low-luminosity cataclysmic variable V405 Pegasi⋆
1 Leibniz-Institut für Astrophysik Potsdam (AIP), An der Sternwarte 16, 14482 Potsdam, Germany
e-mail: aschwope@aip.de
2 Department of Physics and Astronomy, 6127 Wilder Laboratory, Dartmouth College, 03755-3528 Hanover, Germany
Received: 13 September 2013
Accepted: 28 November 2013
Context. V405 Peg is a low-luminosity cataclysmic variable (CV) that was identified as the optical counterpart of the bright, high-latitude ROSAT all-sky survey source RBS1955. The system was suspected to belong to a largely undiscovered population of hibernating CVs. Despite intensive optical follow-up its subclass however remained undetermined.
Aims. We want to further classify V405 Peg and understand its role in the CV zoo via its long-term behaviour, spectral properties, energy distribution and accretion luminosity.
Methods. We perform a spectral and timing analysis of XMM-Newton X-ray and ultra-violet data. Archival WISE, HST, and Swift observations are used to determine the spectral energy distribution and characterize the long-term variability.
Results. The X-ray spectrum is characterized by emission from a multi-temperature plasma. No evidence for a luminous soft X-ray component was found. Orbital phase-dependent X-ray photometric variability by ~50% occurred without significant spectral changes. No further periodicity was significant in our X-ray data. The average X-ray luminosity during the XMM-Newton observations was LX,bol ≃ 5 × 1030 erg s-1 but, based on the Swift observations, the corresponding luminosity varied between 5 × 1029 erg s-1 and 2 × 1031 erg s-1 on timescales of years.
Conclusions. The CV subclass of this object remains elusive. The spectral and timing properties show commonalities with both classes of magnetic and non-magnetic CVs. The accretion luminosity is far below than that expected for a standard accreting CV at the given orbital period. Objects like V405 Peg might represent the tip of an iceberg and thus may be important contributors to the Galactic Ridge X-ray Emission. If so they will be uncovered by future X-ray surveys, e.g. with eROSITA.
Key words: stars: individual: V405 Pegasi / novae, cataclysmic variables / X-rays: binaries / accretion, accretion disks
© ESO, 2014
1. Introduction
Cataclysmic variables (CVs) are close interacting binaries, consisting of a white dwarf primary star accreting matter from a low-mass late-type main-sequence secondary star via Roche lobe overflow. Depending on the strength of the magnetic field of the white dwarf an accretion disk may form or not. In quiescent non-magnetic CVs, X-rays are thought to originate from a boundary layer between the inner disk and the surface of the white dwarf. In magnetic CVs X-rays originate from an accretion column at or near the magnetic poles. The columns may be fed via magnetospheric accretion from the inner boundary of a truncated disk, as in the subclass of intermediate polars (IPs), or from a funneled accretion stream in AM Herculis stars (also termed polars). The X-ray spectra of magnetic and non-magnetic CVs are typically described by multi-temperature thermal plasma emission, being either collisionally or photo-ionized (for reviews of the X-ray emission of magnetic and non-magnetic CVs see e.g. Baskill et al. 2005; Mukai et al. 2003; Kuulkers et al. 2006).
The X-ray signal may be modulated on the orbital and the spin phase. The X-ray brightness may show phase-dependent changes due to geometric obscuration by the stellar bodies (eclipses and self-eclipses) and by absorbing matter close to the accretion regions, to the disk or in the magnetosphere. X-ray reflection may occur in magnetic and non-magnetic CVs, most obviously via the detection of the FeI Kα line at 6.4 keV.
A distinct spectral feature of many magnetic CVs is a luminous soft X-ray component that can be described by blackbody emission in the range kT ≃ 20−50 eV. The prevalence of this component led to the numerous discoveries of magnetic CVs in the ROSAT All-Sky Survey (RASS; see e.g. Beuermann & Burwitz 1995; Schwope et al. 2002).
V405 Pegasi (also known as RBS 1955) was identified as a bright, nearby CV in an optical identification program of bright, high-latitude RASS sources, the ROSAT Bright Survey (RBS, Schwope et al. 2000) and initially classified as a non-magnetic CV (Schwope et al. 2002). Extensive optical spectroscopic and photometric follow-up observations obtained between 2002 and 2006 were presented by Thorstensen et al. (2009). This study revealed a parallax of  pc and the occurrence of high and low states. The M3.5 ZAMS secondary star can clearly be recognized in the optical spectrum in all accretion states and dominates the photometric variability through ellipsoidal modulations in the low state. From M-star absorption-line spectroscopy an orbital period of 4.2635 h and a radial velocity semi-amplitude of 92 ± 3 km s-1 were obtained, implying a rather low orbital inclination if masses were typical. From the same data the time of inferior conjunction of the secondary star was measured, T0 = HJD 2 452 623.6767(1), which determines phase zero throughout this paper.
An unambiguous classification of the object was not possible. Following Thorstensen et al. (2009) the occurrence of low states can be reconciled with a magnetic system. The object was found to be very much under-luminous at the given orbital period. This gave reason to speculate that V405 Peg might belong to a largely undiscovered population of hibernating CVs. Such a population of post-nova CVs was predicted to exist to resolve the discrepancy between the observed and the predicted nova rates (Shara et al. 1986).
In order to better constrain its nature, hence CV subclass, we performed X-ray and ultra-violet observations with XMM-Newton. Those observations were undertaken with the primary aim to establish its X-ray spectral parameters, to search for a soft component, and to search for the spin period of the accreting white dwarf.
Our analysis is supported by several archival X-ray observations performed with the Swift-XRT and UVOT, and WISE infrared and HST ultra-violet observations.
2. Observations and data reduction
A summary of the observations reported in this paper is given in Table 1.
Summary of new X-ray, ultraviolet and optical observations of V405 Peg.
2.1. XMM-Newton X-ray and ultraviolet observations
V405 Peg was observed with XMM-Newton for about ~53 ks on 2009 December 29 (observation ID 0604060101), thus covering 3.45 cycles of the 4.26 h binary. The EPIC-pn and -MOS cameras were operated in full frame mode with the thin filter inserted. The RGS spectrographs were used with their spectroscopy modes, respectively. Simultaneous ultraviolet photometry was obtained with the Optical Monitor (OM) in timing mode. The UVM2 and UVW2 filters were used sequentially, the UVM2 for ~22.7 ks (1.5 binary cycles) and the UVW2 for ~29.0 ks (1.9 binary cycles). The filters cover the wavelength intervals 1970–2675 Å and 1805–2454 Å, respectively.
The raw data were reduced using the XMM-Newton Science Analysis System (sas) version 11.0.0. The EPIC-pn and MOS data were processed with the standard tasks epproc and emproc, respectively, to generate calibrated event lists. The observations were affected during the first 12.5 ks of the XMM-Newton observations by non-optimum space weather, with background count rates in excess of 0.4 s (EPIC-pn, 0.2 − 12 keV). For the spectral and timing analysis those time intervals were removed.
For both the MOS and pn detectors, spectra were extracted from a circular source region of 45 arcsec radius and light curves from a circular source region of 25 arcsec radius, and the background from either a circular or a box-shaped source-free region on the same CCD. Different extraction regions were used for the spectral and the timing analyses due to the different impact on the unstable background signal in the two cases. The count rate accuracy of individual time bins is more affected by an unstable background than the average spectrum.
The response files for the spectral analysis were generated using the rmfgen and arfgen tasks and all spectra were rebinned to a minimum of 20 counts per bin in order to use the χ2 statistics for goodness of fit and parameter estimation. The mean net count rates were 0.627 ± 0.004 s-1 for EPIC-pn, and 0.160 ± 0.002 s-1 for EPIC-MOS (mean of both cameras).
All timing data shown in this paper were corrected to the barycenter of the Solar system with the barycen task. Background-subtracted light curves in different energy bands were generated using the task epiclccorr with time bins of 100 s and 200 s.
The RGS data were reprocessed with the standard task rgsproc, by which first order source and background spectra were produced with mean net count rates of 0.013 ± 0.001 s-1 for RGS1 and 0.016 ± 0.001 s-1 for RGS2. Since the count rates were so low the RGS-data were not considered for the spectral analysis.
The OM data were reduced and background-subtracted using the omfchain routine with 100 s time binning. Barycentric corrections were also applied as for the EPIC data. The mean count rates were 0.63 ± 0.05 s-1 in the UVM2 band and 0.19 ± 0.03 s-1, in the UVW2 band. The light curves obtained with the optical monitor are shown in original time sequence and phase-folded in Figs. 1 and 2.
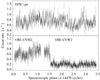 |
Fig. 1 Background-subtracted X-ray and UV light curves of V405 Peg obtained with XMM-Newton on Dec. 29, 2009. The data were binned using a bin size of 100 s. They are shown in original time sequence with time transformed to binary phase using the ephemeris of Thorstensen et al. (2009). Phase zero refers to the inferior conjunction of the secondary star. |
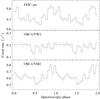 |
Fig. 2 Phase-averaged XMM-Newton X-ray and UV light curves of V405 Peg with a phase resolution of 0.05 phase units. All data are shown twice for easier recognition of repeated features. |
2.2. Swift XRT and UVOT observations
The Swift observatory observed the field of V405 Peg in three occasions in July 2008 and four occasions in October 2012 (see Table 1). All observations were short, the maximum observation length was about 2500 s (16% of the orbital cycle).
The XRT-data were reduced with the online analysis tools provided by the ASI Science Data Center1. Calibrated count rates, corrected for deadtime and coincidence losses, were read from the standard pipeline (level 3) products made available via the same web-site. Mean count-rates per observation obtained with the X-ray telescope XRT are listed in Table 2. The results of UVOT photometry, kindly made available by Dr. Page (MSSL), are not listed in tabular form but shown graphically in Fig. 8.
The object was found to be strongly variable between the various occasions. At X-ray wavelengths the source varied by a factor 40 on timescales of years (between 2008 and 2012), by a factor of ~10 on a timescale of weeks (between the observations obtained in 2008) and by a factor of 2 within three days in October 2012.
The UV variability was found to be similarly pronounced. The largest amplitude (factor 45) is observed in the blue-most filter (UVW2) between 2008 and 2012.
Swift XRT parameters of V405 Peg.
2.3. STELLA/WiFSIP optical photometry
V405 Peg was observed during four nights with the robotically controlled telescope STELLA-I located at an altitude of 2400 m on the island of Tenerife (Strassmeier et al. 2004). The telescope is permanently equipped with the Wide-Field STELLA Imaging Photometer (WiFSIP, Weber et al. 2012). Our data were obtained during commissioning of the instrument through a g-filter. Individual exposure times were 120 s, the achieved time resolution with the available instrumental setup at that time was 160 s. During each of the nights full phase coverage could be achieved. All observations were performed under clear sky with little seeing and transparency variations. Differential photometric magnitudes were computed with respect to the nearby object SDSS J230944.80+213537.2, the resulting light curves are shown in Fig. 4.
2.4. Further archival data on V405 Peg
The mean low-state spectrum obtained by Thorstensen et al. (2009) has synthetic magnitudes of gri = 17.9,16.5,15.4, respectively.
An SDSS spectrum was obtained on August 16, 2008. It shows a rich emission-line spectrum very similar to that shown by Thorstensen et al. (2009), thus indicating a high accretion state. By folding the observed spectrum through the SDSS ugriz filter curves, approximate SDSS magnitudes were determined: ugriz = 16.71,16.47,15.80,14.84,14.09. SDSS photometry, ugriz = 15.78,16.10,15.35,14.65,14.09, was indicative of another even higher state of accretion (see Fig. 8 for a graphical representation of both, SDSS spectroscopy and photometry, and the mean low-state spectrum).
Archival data are available in the infrared (2MASS, WISE) and the ultraviolet spectral ranges. The 2MASS JHK magnitudes are 12.67, 12.01, and 11.81 (± 0.02 mag for all three filters), and the WISE W1, W2, W3 magnitudes at central wavelengths 3.4, 4.2, and 12.0 μm are 11.771 ± 0.023,11.608 ± 0.022,11.302 ± 0.146, respectively. The data in W4 are unreliable.
An HST spectrum was obtained on Dec. 7, 2012, with the Cosmic Origins Spectrograph (proposal ID 12870, PI B. Gänsicke) and grating G140L covering the wavelength range 1165−2148 Å. Time-tagged data were obtained for about two hours of total exposure time. We make use of the time-averaged preview spectrum when discussing the spectral energy distribution in Sect. 3.3.
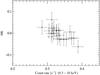 |
Fig. 3 Hardness ratio vs. soft count-rate of the phase-averaged EPIC-pn data in 20 phase bins. For definitions of soft and hard bands see text. |
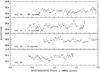 |
Fig. 4 STELLA/WiFSIP differential photometry obtained in July 2012 using an SDSS g-filter. |
3. Analysis and results
3.1. X-ray spectral and timing analysis
3.1.1. XMM-Newton X-ray and ultraviolet light curves
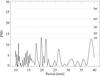 |
Fig. 5 Lomb-Scargle periodogram of de-trended EPIC-pn data (boxcar mean subtracted). |
X-ray light curves covering the whole EPIC energy range (0.2−12 keV) are shown in original time sequence and phase-averaged in Figs. 1 and 2. The light curve in original time sequence does not show a clear orbital modulation but is affected by strong flickering. At a time resolution of 100 s the EPIC-pn X-ray count rate varied between 0.4 and 1.2 s-1.
When folded and averaged over the orbital phase of 4.26 h the X-ray light curve shows some weak orbital phase dependent modulation with bright and faint phases lasting from about φ = 0.6 to 1.15, and from φ = 0.15 to 0.60, respectively. The mean count rates during those orbital phase intervals differ by about 15%. The orbital minimum occurs at phase 0.6.
We searched for phase-dependent changes of the X-ray color by analysing the hardness ratio HR2 of the EPIC-pn data. The whole energy band was divided in two sub-bands, 0.3−1.0 keV and 1 − 10 keV, with approximately the same number of photons. The corresponding binned light curves with time bin size of 200 s were found to resemble each other. The hardness ratio does show a slight dependency on the orbital phase, the spectrum being softest at highest count-rate. This behavior is best visible in the CR-HR plane shown in Fig. 3.
V405 Peg was observed with the OM-UVM2 for nearly 1.5 orbital cycles, and with the UVW2 for about 2 orbital cycles. While some variability is apparent in the UVM2 data, the UVW2 light curve appears almost flat. The phase-folded UVM2 light curve resembles that of EPIC-pn, but part of this kind of variability with bright and faint phases might be mimicked by overall trends in the light curve. The overall coverage of the system is too short to make a robust statements about a possible phase-dependent UV variability.
Fit statistics and fit parameters of the spectral models applied to the mean orbital EPIC X-ray spectrum of V405 Peg.
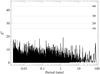 |
Fig. 6 Results of the Z2 search (EPIC-pn data, P = 0.1468−54 000 s). The frequency range is Δν ~ 6.8 Hz, the energy band is 0.2 − 7 keV and the size of the extraction region is 10″, amounting to ~13 500 counts. Dashed horizontal lines show confidence levels of 1σ to 4σ for the detection of a periodic signal, given the frequency range, the duration of the observation and the number of source photons in the search. For plotting purposes, a logarithmic step in frequency was adopted, resulting in a smaller number of frequency trials than in the original search (of the order of 3.4 × 10⁶ data points). No significant periodicity with pulsed fraction higher than ~5% (1σ) is found. |
3.1.2. XMM-Newton timing analysis
Thorstensen et al. (2009) suggested a possible magnetic nature of V405 Peg, the subclass however remained unclear. One of the reasons for obtaining XMM-Newton X-ray observations was the search for periodic X-ray variability, in particular to search for the spin periodicity of the white dwarf, should the object belong to the IP subclass.
If V405 Peg would be a typical IP, the spin period could be expected in the range 0.05 ≤ Pspin/Porb ≤ 0.15 (see Norton et al. 2008, for theoretical simulations and Scaringi et al. 2010, for a recent compilation of observed data). The orbital period of V405 Peg is 4.2635 hr, therefore we expect Pspin to be between 12 min and 40 min. Using the Lomb-Scargle technique, we searched for a periodic behaviour of the source in a range between 10 min and 40 min. Several versions of binned EPIC-pn light curves were used for this exercise, the original one and de-trended versions. De-trending was achieved by either subtracting boxcar averages or by subtracting the phase-averaged orbital mean. Different time bins (10 s and 60 s) and different boxcar sizes were tested, 10 m, 30 m and 60 m. No significant periodicity was found in either attempt, and the highest peaks in the periodogram hardly reach the 1σ confidence limit (see Fig. 5 for the periodogram obtained after subtracting a 60 m boxcar average as one example).
Alternatively, we searched for the spin period of the white dwarf by means of a  (Rayleigh statistics) test (Buccheri et al. 1983), which works directly on the (barycenter-corrected) times-of-arrival of individual photons. Due to high background activity, we discarded the first ~12 ks of the pn exposure to avoid contamination and aliasing artifacts in the search. In order to optimize the signal-to-noise ratio of the data, we tested several different energy bands and radii of the source extraction region in the period range of P = 0.15 s to 90 min. We adopted a step in frequency of 2 μ Hz (or an oversampling factor of 10), warranting that a peak corresponding to a periodic signal is not missed. Despite all tests, no significant periodicity with pulsed fraction higher than 5% (1σ, 0.2 − 7 keV) was found in the period range of the search (Fig. 6).
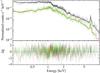 |
Fig. 7 Mean orbital X-ray spectrum of V405 Peg (EPIC-pn and -MOS) with best-fitting MKCFLOW model superposed, using MEKAL components. |
3.1.3. XMM-Newton X-ray spectral analysis
The X-ray spectra were analyzed using the HEASARC software package xspec (version 12.7.0). EPIC-pn and EPIC-MOS data were treated simultaneously. The spectra exhibit a continuum component with pronounced helium- and hydrogen-like Iron lines superposed. The most simple model for this type of spectrum which is often encountered in CVs consists of a single-temperature thin thermal plasma model (MEKAL or APEC in XSPEC terminology). Initially an absorption model was included to account for absorption by neutral interstellar matter. The amount of hydrogen column absorption that was found was of order NH = (4 ± 3) × 1019 cm-2, hence much below the total Galactic HI column density of NH = 6.15 × 1020 cm-2 (Dickey & Lockman 1990) due to the proximity of the source. The value of this badly constrained component had no effect on the other parameters and we omitted the absorption component when compiling the spectral parameters listed in Table 3. We used the elemental abundance tables by Anders & Grevesse (1989) and set those to the solar value.
The single-temperature model, however, did not provide a good fit to the data ( for 1062 degrees of freedom), it left large positive residuals at low energies (fit parameters are listed in Table 3). A much better fit was achieved by taking a second MEKAL component into account. Formally, the fit was satisfactory (
 for 1060 degrees of freedom), but some coherent photon excess above 5 keV could be indicative of a further high-temperature component. Some support for this view may be derived from a single-temperature fit to only the high energy range, 3−10 keV. The fit revealed kT = 6.0 ± 0.9 keV, gave a satisfactory fitting statistics (
 for 183 degrees of freedom) and left no systematic residuals at high energies. A further improvement to the fit of the whole spectrum could thus be achieved when adding a third MEKAL component. The result of this fit cannot be distinguished from the fit labeled 2MEKAL in Table 3 by a comparison of the fitting statistics but the fitting residuals show random scatter only.
The sum of three MEKAL components is a rough approximation of a model with a continuous temperature distribution. Such a model is also available in XSPEC (MKCFLOW, Mushotzky & Szymkowiak 1988, originally designed to describe cooling flows in clusters of galaxies), its application to V405 Peg yields  for 1066 degrees of freedom (fit parameters in Table 3). Figure 7 shows the mean orbital X-ray spectrum together with the best-fitting MKCFLOW model. The MKCFLOW model fits lower and upper temperature limits to an observed spectrum. We regard the fitted parameters as well as the associated errors as indicative only due to the limited spectral coverage of the EPIC detectors. This prevents one from reliably determining higher and lower temperatures. Otherwise, the measured upper limit temperature could be used to constrain the mass of the white dwarf.
Table 3 lists in the last column the flux in the 2 − 10 keV band, which is only little dependent on the chosen model. The bolometric correction from the unabsorbed 2−10 keV flux to the total flux for the best-fitting MKCFLOW model was determined within XSPEC by integrating the corresponding models and was found to be kbol ≃ 2.6.
As described in Sect. 3.1.1 (see also Fig. 3) a slight dependence of the spectral hardness as a function of the count rate is observed. Therefore X-ray spectra for the “bright” and the “faint” phases were extracted to search for a possible variability of the spectral parameters. A combined fit was applied to the two spectra simultaneously with a sum of two MEKAL models, a hot and a cold one. The temperatures and the abundances of both the hot and the cold components were forced to be the same for the bright- and faint-phase spectra, only the normalization of the components were allowed to vary independently. Again, the fit was satisfactory,  (for 800 d.o.f.). The temperatures of the combined fit were the same as those of the 2MEKAL fit applied to the mean spectrum (Table 3). The normalization parameters of the combined fit are Nb,h = (8.0 ± 0.3) × 10-4 cm-5, Nf,h = (7.3 ± 0.2) × 10-4 cm-5, Nb,c = (4.2 ± 0.8) × 10-5 cm-5, Nf,c = (3.8 ± 0.8) × 10-5 cm-5, where subscripts b,f and h,c denote bright and faint phases, and hot and cold components, respectively, and the errors are given for a 90% confidence interval. Hence, the normalization of the hotter thermal component can be made responsible for the observed small spectral variability, a possible phase-dependent temperature change could not be inferred from the data.
The iron line complex consists of only two components that can clearly be resolved: the two plasma emission lines of helium-like iron line at 6.7 keV and of hydrogen-like iron line at 6.97 keV. The fluorescent Kα line of neutral iron at 6.4 keV is not detected. We estimated an upper limit for its line flux and the corresponding equivalent width by performing a multi-temperature plasma fit (MKCFLOW) to the restricted energy range of 5 − 8 keV with a superposed Gaussian line at fixed line energy (6.41 keV) and line width. An unresolved line was assumed, the intrinsic line width was set to zero, hence the observed line width was defined by the instrumental resolution at this energy. The maximum flux of the Gaussian line was estimated from the 90% confidence error of the normalization parameter, FKα = 6 × 10-15 erg cm-2 s-1, and resulted in an upper limit for the equivalent width of 90 eV.
One often finds a prominent soft component in the X-ray spectra of MCVs, both of the polar and the IP subtype. This is typically modeled assuming blackbody emission. An upper limit flux for such a component was estimated by assuming cold interstellar absorption with NH fixed at 5 × 1019 cm-2 and adding a blackbody to the MKCFLOW model with fixed temperature kT = 30 eV and was found to be Fbol = 1 × 10-13 erg cm-2 s-1. Hence, a soft component with a temperature as typically found in magnetic CVs reveals a bolometric flux which is below 5% of the main plasma component.
3.1.4. Swift X-ray spectroscopy
Individual observations with Swift were short and suffer from low photon numbers. Those with the highest number of photons however are not compatible with a single temperature plasma model. We therefore decided to use the MKCFLOW model with the same minimum and maximum temperature as derived from XMM-Newton and to perform a fit using only the normalization as free parameter. This gave a roughly satisfactory fit to most of the data. We used this model to compute a conversion factor from count-rate to bolometric flux of ECF = 5 × 10-11 erg cm-2 per count. Using this ECF and assuming that the spectral shape does not change with brightness the observed variable count-rate translates into bolometric flux. All measured count-rates and the derived fluxes are listed in Table 2.
3.2. Optical variability
During the four nights of observations in July 2012, V405 Peg varied between g = 16.1−16.6 on time scales as short as ~10−30 min (~0.05−0.1 orbital phase units). According to the low- and high-state magnitudes listed in Sect. 2.4, the July 2012 photometry clearly represents a high state of the object.
The variability pattern does not show any obvious periodicity. A periodogram of these data derived with the analysis of variance (AOV) method (Schwarzenberg-Czerny 1989) reveals some weak signals at periods that were also present in the high-state I-band photometric data of September/October 2005 in Thorstensen et al. (2009, their Fig. 8). In the current periodogram one may recognize some power in the prominent period “P2” from 2005 at 251 min and its one day alias at 213 min. The power on the orbital period is much weaker, but neither of the mentioned periods is regarded as significant given the relatively brief observation performed in July 2012. The high-state g-band variability pattern thus shows some resemblance to the high-state I-band variability.
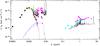 |
Fig. 8 Infrared to X-ray spectral energy distribution of V405 Peg. Photometric data were obtained with WISE and 2MASS (black filled squares), the SDSS (green squares), UVOT (magenta rhombs, data obtained through one OBSID are connected by lines), the OM (black rhombs), and GALEX (black squares). Observed spectra are obtained from the SDSS (high state optical), the HST archive (high-state ultraviolet), and from Thorstensen et al. (2009; low-state optical). For model spectra see text. In the X-ray spectral regime spectra are shown obtained with XMM-Newton (black line), Swift (magenta, high state spectrum obtained 2012-10-30, low state 2008-06-04; for the latter spectral shape was not measured, but assumed to be the same as in the high state for illustration purposes), and ROSAT (cyan squares). |
3.3. The spectral energy distribution
Our own follow-up and archival data led to several new data points to be included in the spectral energy distribution (a previous version was shown by Thorstensen et al. 2009, their Fig. 11). The updated infrared to X-ray distribution is shown in Fig. 8. From long to short wavelengths it includes data obtained with WISE, 2MASS, the SDSS (both photometrically and spectroscopically), Swift-UVOT, GALEX, XMM-Newton OM, the HST, ROSAT-PSPC, Swift-XRT, and XMM-Newton EPIC. Suitably adapted model spectra for the companion star and the white dwarf are indicated with red and blue lines, respectively. They represent a cool star PHOENIX and a DA WD model spectrum kindly made available by Drs. Hauschildt and Koester.
Using the recent UVOT data one can derive improved constraints for the white dwarf compared to Thorstensen et al. (2009). They estimated the white dwarf’s effective temperature from the spectral flux at the blue end of the low-state spectrum. The contribution of the companion star however is non-negligible. We therefore firstly subtract the likely contribution of an M4 ± 0.5 companion star which leaves an average flux of (1.1 ± 0.5) × 10-16 erg cm-2 s-1 Å-1 (450−480 nm). Assuming a standard 0.6 M⊙ white dwarf the effective temperature is in the range 9500 ± 1500 K for an assumed distance of 150 pc. This still may be regarded as an upper limit flux because it ascribes the remaining flux to the white dwarf exclusively. It neglects a weak contribution from a recombination continuum, a recombination component is obvious otherwise through Balmer Hα and Hβ emission. The chosen white dwarf model nicely fits to the lowest UVOT-flux obtained through filter UVW2 on June 4, 2008, hence the likely temperature of 10 000 K is the maximum temperature for a standard white dwarf at the nominal distance.
At most occasions the ultraviolet flux is a factor 10−20 higher than predicted by the white dwarf alone due to accretion-induced radiation. The UVOT-photometry traces the recombination spectrum originating from an accretion disk or an accretion stream from the high-state SDSS- to the high-state HST-spectrum. The OM, hence XMM-Newton observations, were obtained in an intermediate state of accretion with reduced UV flux by a factor ~3 with respect to GALEX and most UVOT data. Our own g-band photometry is not shown in the figure, the object varied between the levels given by the SDSS-spectrum and the SDSS-photometry.
The infrared part of the SED is dominated by the companion star. The observed colors W1 − W2 = 0.163 ± 0.045 and W2 − W3 = 0.31 ± 0.17 are consistent with those of a mid M-star (cf. Kirkpatrick et al. 2011) leaving little (if any) room for any other radiation component that is prominent in other CVs (cyclotron, accretion disk, dust disk, recombination).
The UV spectrum shows a rich emission line spectrum of HeII, CIV, SiIV, CII, Si II/III, and NV on top of a mildly red continuum. The set of emission lines is typical for optically thin gas from either an accretion stream in polars or from a quiescent accretion disk in dwarf novae (for UV spectra of polars see e.g. Araujo-Betancor et al. 2005). The COS spectra of the dwarf novae DT Oct and BB Dor are almost carbon copies of that of V405 Peg. Hence, the average UV-spectrum does not seem to disentangle between a magnetic and non-magnetic nature of V405 Peg.
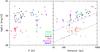 |
Fig. 9 Magnetic and non-magnetic CVs in the LX − Porb and the LX − D planes. Luminosities, periods and distances were taken from Pretorius & Knigge (2012), Pretorius et al. (2013), Reis et al. (2013), Byckling et al. (2010), and Baskill et al. (2005). Luminosities given in certain spectral bands were corrected with bolometric correction factors using the spectral parameters given in the papers mentioned. The black larger symbol indicates the XMM-Newton observation of V405 Peg, whereas the bars crossing it indicate the range of luminosities as observed with Swift. Diagonal lines in the right panel indicate the survey limits of the RBS and with eROSITA. |
4. Discussion
We have analyzed new original X-ray and optical spectral and timing data of the peculiar low-luminosity CV V405 Peg and put them in context with multi-lambda data available in the literature.
What kind of CV is V405 Peg? The various possibilities were discussed by Thorstensen et al. (2009) and we re-iterate here the main points in the light of the new observations. Evidence may be found from the X-ray spectrum, X-ray and optical variability on orbital and much longer time scales, and the spectral energy distribution.
The X-ray spectrum is well reflected by an optically thin multi-temperature plasma which accounts for both the continuum and the ionized emission lines of Fe. That kind of X-ray spectrum is found in magnetic and non-magnetic CVs, originating either from the post-shock regions in accretion columns or the boundary layers of disk-accreting CVs. The absence of a black-body like soft X-ray component does not further help to classify the object, since the notorious soft X-ray component of many ROSAT-discovered magnetic CVs can no longer be regarded as their observational hallmark (Ramsay & Cropper 2004). The XMM-Newton X-ray spectrum does not show any sign of absorption, neither by cold interstellar matter nor by warm matter in the vicinity of the site where the X-rays are generated. There is also no sign of X-ray reflection, but again, this does not classify the source, since Fe reflection lines were seen in magnetic and non-magnetic CVs.
Perhaps most constraining at X-ray wavelengths is the observed variability, both on short (orbital) and longer timescales. V405 Peg is a low-inclination system, orbital X-ray variability in non-magnetic CVs is observed only in high-inclination system (Baskill et al. 2005), hence the observed orbital variability argues for a magnetic CV. Also the observed large-amplitude variability at X-ray and ultraviolet wavelengths gives further evidence for the absence of an accretion disk which would act as a mass repository. The X-ray luminosity varied between 5 × 1029 erg s-1 and 2 × 1031 erg s-1 among the Swift pointings. When observed with XMM-Newton the object was in an intermediate state of accretion with 5 × 1030 erg s-1, which compares to its brightness at discovery in the RASS. If this brightness is typical, the object is under-luminous at the given orbital period, at its bright limit it roughly compares to other CVs at that period (see Fig. 9 and the discussion further down in this section).
If magnetic, a further subdivision into the polar or the intermediate polar subclass would be of interest. Neither our new time-resolved optical photometric observations nor the X-ray data revealed any significant (new) period. We noticed weak X-ray variability as a function of the binary orbital phase. The absence (or better saying the non-detection) of a much shorter periodicity that could be associated with the spin of the white dwarf, might argue for a CV of polar type, but evidence is low. The X-ray bright phase is centered roughly on phase zero, which would fit in the known picture of polars where the accreting pole faces the mass-donating star. If being a polar, the non-detection of any magnetic feature in the optical/UV/IR is puzzling. Neither Zeeman-shifted white-dwarf atmospheric absorption lines nor cyclotron emission lines could be discovered. The observed SED leaves little room for a pronounced cyclotron component at all. However, a final statement on the presence of a weak cyclotron component requires time-resolved multi-wavelength polarimetry, which is encouraged.
We could further constrain the temperature of the white dwarf in the system through UVOT and OM photometry to be likely below 10 000 K (the previous limit was 17 000 K), which makes membership of the VY Sculptoris subclass even more unlikely than discussed previously. The UV emission line spectrum obtained in a high state shows similarities with both quiescent dwarf novae and normally accreting polars. The observed very low temperature of the WD might give further evidence for a magnetic CV. Similarly cool WDs were found in long-period CVs, i.e. those above the 2−3 h period gap, in polars only. There is not any other WD in a long-period CV among the objects studied by Townsley & Gänsicke (2009) that is as cool as that in V405 Peg (see in particular their Fig. 5). The implied very low mean mass transfer rate, ⟨ Ṁ ⟩ < 10-10 M⊙ yr-1 is orders of magnitude below that expected for traditional magnetic braking (Howell et al. 2001) but merely consistent with gravitational radiation losses only. Our result rests on the low-state spectrum (spectrophotometric uncertainty ~20%) and the one low-state photometric data point obtained with Swift-UVOT. Hence, a low-state, phase-resolved, spectroscopic study in the ultraviolet would therefore be very much demanding, to ascertain our tentative result and thus confirm the existence of a long-period CV with a mean mass transfer rate below all predictions of wind-driven angular momentum loss models.
What are the prospects of finding more objects of the V405 Peg type? It might be instructive to place V405 Peg in the  and the LX − D landscapes of CVs. In Fig. 9 various CV subsamples are shown with well-determined distances, part of those were used to determine the space density and luminosity functions of CVs. Data were taken from Baskill et al. (2005); Reis et al. (2013); Pretorius & Knigge (2012); Pretorius et al. (2013); Byckling et al. (2010). Byckling et al. (2010) were using a sample of non-magnetic CVs (dwarf novae, to be more precise) with parallax-based distance measurements to constrain the CV luminosity function. Baskill et al. (2005) presented the complete set of ASCA observations of non-magnetic CVs, only a subset has precise distances, hence luminosities. Reis et al. (2013) studied a sample of optically selected (mostly SDSS) non-magnetic CVs which they followed with Swift to uncover the intrinsic differences in the X-ray properties of optically selected CVs and those that were discovered via other routes. Pretorius & Knigge (2012) and Pretorius et al. (2013) were using X-ray selected CVs (mostly from the RBS) to derive space densities and uncover intrinsic differences between magnetic and non-magnetic CVs. Data for the (likely) wind-accreting pre-polars (PREPs, Schwope et al. 2009) – often referred to a LARPs (Low-Accretion Rate Polars Schwope et al. 2002) – are also included in the figure. They were adopted from Vogel et al. (2007, 2011) and yet unpublished own results.
Reis et al. (2013), Pretorius & Knigge (2012) and Pretorius et al. (2013) each used a certain spectral model with fixed parameters to convert the measured count rates with Swift and ROSAT to fluxes and luminosities. These were derived for the spectral ranges covered by the mentioned satellite observatories. The X-ray luminosities as given there were thus modified by bolometric correction factors of ΔL = 0.17 and 0.68, respectively, to put all luminosity values that are displayed in the diagram on a common scale. The bolometric correction factors were computed using XSPEC with the spectral parameters as given in the mentioned papers.
Double entries were removed from the various lists of CVs. The diagonal lines in the right panel indicate the flux limits of the ROSAT Bright Survey (RBS, Schwope et al. 2000), fX = 2.4 × 10⁻¹² erg cm-2 s-1, and that of a corresponding eROSITA bright survey, which will be a factor 30 more sensitive (Merloni et al. 2012).
Accreting white-dwarf main-sequence binaries are seen to occupy distinct regions in the diagrams. Outbursting and intrinsically bright objects are observed at all periods with log LX,bol> 30.5 erg s-1. Those objects show a correlation between orbital period and X-ray luminosity (Baskill et al. 2005). This appears, however, much weaker than expected from population synthesis, would the X-ray luminosity scale proportionally with the mass accretion rate (Howell et al. 2001).
In contrast to this (seemed) typical CV population, Reis et al. (2013) recently presented an X-ray study of SDSS-selected, short-period, white-dwarf dominated, hence low-luminosity objects. About 90% of the objects studied by them were found to be X-ray emitters, all of them were found below the RBS-limit. In particular, they suggest that such sources could contribute significantly to the GRXE (Galactic Ridge X-ray Emission), would this (yet to be discovered) large population of low-luminosity objects exist. An optical selection based on colors for spectroscopic follow-up in the SDSS removes an X-ray luminosity bias from existing samples, however, it introduces a color-dependent bias. Since all CVs are known to be notorious X-ray emitters, unbiased samples may eventually be constructed from sensitive X-ray surveys, like those planned with eROSITA.
Even fainter but at longer orbital periods than the SDSS-selected CVs studied by Reis et al. (2013) are the wind-accreting PREPs. Contrary to the other objects shown in the diagram they are thought to be Roche-lobe under-filling, which explains their low luminosities. V405 Peg at a long orbital period, i.e. above the period gap, with its huge observed X-ray variability represents a bridge between the PREPs and the CVs accreting from Roche-lobe overflow.
V405 Peg may be the first of many more to be discovered from eROSITA surveys. With ROSAT, similar objects could be detected within a radius of 150 pc. If as bright as during the XMM-Newton observations analyzed in this paper, such objects will be detectable up to 800 pc, sufficient to compose volume-limited samples which shall be essentially free from selection bias.
V405 Peg is just one out of 42 CVs studied by Pretorius et al. (2012, 2013) above the flux limit of the RBS and thus might be regarded as rare. It is worth to be noted that on the other hand one (EX Dra) out of 4 CVs discovered in the much deeper NEP survey (North Ecliptic Pole survey) shares properties with V405 Peg (Porb = 5.039 h, log LX,bol = 30.4 erg s-1; EX Dra is the object next to V405 Peg in Fig. 9 at slightly longer period). The upcoming eROSITA surveys will be similarly deep as the NEP survey but cover the whole sky, not just 81 square degrees.
5. Conclusions
We have analyzed new observations obtained with XMM-Newton and Swift at X-ray and ultraviolet wavelengths, and optical photometry with STELLA/WiFSIP and discussed our results together with multi-wavelength archival observations. The nature of V405 Peg remains elusive in the sense that its CV subclass remains uncertain. It may represent the first of a large population of yet to be discovered almost Roche-lobe filling CVs by future sensitive X-ray surveys.

Acknowledgments
We thank our referee for constructive criticism which helped to improve the paper. This work has been supported by the Deutsches Zentrum für Luft-und Raumfahrt under contracts 50 0R 1011 and 50 OX 1101. AP acknowledges support by the Deutsche Forschungsgemeinschaft under grant Pi983/1-1. We thank M.J. Page for providing the UVOT photometric data. This research has made use of the NASA/ IPAC Infrared Science Archive, which is operated by the Jet Propulsion Laboratory, California Institute of Technology, under contract with the National Aeronautics and Space Administration. Some of the data presented in this paper were obtained from the Mikulski Archive for Space Telescopes (MAST). STScI is operated by the Association of Universities for Research in Astronomy, Inc., under NASA contract NAS5-26555. Support for MAST for non-HST data is provided by the NASA Office of Space Science via grant NNX09AF08G and by other grants and contracts. Funding for the SDSS and SDSS-II has been provided by the Alfred P. Sloan Foundation, the Participating Institutions, the National Science Foundation, the U.S. Department of Energy, the National Aeronautics and Space Administration, the Japanese Monbukagakusho, the Max Planck Society, and the Higher Education Funding Council for England. The SDSS Web Site is http://www.sdss.org/. The SDSS is managed by the Astrophysical Research Consortium for the Participating Institutions. The Participating Institutions are the American Museum of Natural History, Astrophysical Institute Potsdam, University of Basel, University of Cambridge, Case Western Reserve University, University of Chicago, Drexel University, Fermilab, the Institute for Advanced Study, the Japan Participation Group, Johns Hopkins University, the Joint Institute for Nuclear Astrophysics, the Kavli Institute for Particle Astrophysics and Cosmology, the Korean Scientist Group, the Chinese Academy of Sciences (LAMOST), Los Alamos National Laboratory, the Max-Planck-Institute for Astronomy (MPIA), the Max-Planck-Institute for Astrophysics (MPA), New Mexico State University, Ohio State University, University of Pittsburgh, University of Portsmouth, Princeton University, the United States Naval Observatory, and the University of Washington.
References
- Anders, E., & Grevesse, N. 1989, Geochim. Cosmochim. Acta, 53, 197 [Google Scholar]
- Araujo-Betancor, S., Gänsicke, B. T., Long, K. S., et al. 2005, ApJ, 622, 589 [NASA ADS] [CrossRef] [Google Scholar]
- Baskill, D. S., Wheatley, P. J., & Osborne, J. P. 2005, MNRAS, 357, 626 [NASA ADS] [CrossRef] [Google Scholar]
- Beuermann, K., & Burwitz, V. 1995, in Magnetic Cataclysmic Variables, eds. D. A. H. Buckley, & B. Warner, ASP Conf. Ser., 85, 99 [Google Scholar]
- Buccheri, R., Bennett, K., Bignami, G. F., et al. 1983, A&A, 128, 245 [NASA ADS] [Google Scholar]
- Byckling, K., Mukai, K., Thorstensen, J. R., & Osborne, J. P. 2010, MNRAS, 408, 2298 [NASA ADS] [CrossRef] [Google Scholar]
- Dickey, J. M., & Lockman, F. J. 1990, ARA&A, 28, 215 [NASA ADS] [CrossRef] [MathSciNet] [Google Scholar]
- Howell, S. B., Nelson, L. A., & Rappaport, S. 2001, ApJ, 550, 897 [NASA ADS] [CrossRef] [Google Scholar]
- Kirkpatrick, J. D., Cushing, M. C., Gelino, C. R., et al. 2011, ApJS, 197, 19 [NASA ADS] [CrossRef] [Google Scholar]
- Kuulkers, E., Norton, A., Schwope, A., & Warner, B. 2006, X-rays from cataclysmic variables, eds. W. H. G. Lewin, & M. van der Klis (Cambridge: Cambridge University Press), 421 [Google Scholar]
- Merloni, A., Predehl, P., Becker, W., et al. 2012 [arXiv:1209.3114] [Google Scholar]
- Mukai, K., Kinkhabwala, A., Peterson, J. R., Mahn, S. M., & Paerels, F. 2003, ApJ, 586, L77 [NASA ADS] [CrossRef] [Google Scholar]
- Mushotzky, R. F., & Szymkowiak, A. E. 1988, in Cooling Flows in Clusters and Galaxies, ed. A. C. Fabian, NATO ASIC Proc. 229, 53 [Google Scholar]
- Norton, A. J., Butters, O. W., Parker, T. L., & Wynn, G. A. 2008, ApJ, 672, 524 [NASA ADS] [CrossRef] [Google Scholar]
- Pretorius, M. L., & Knigge, C. 2012, MNRAS, 419, 1442 [NASA ADS] [CrossRef] [Google Scholar]
- Pretorius, M. L., Knigge, C., & Schwope, A. D. 2013, MNRAS, accepted [arXiv:1303.4270] [Google Scholar]
- Ramsay, G., & Cropper, M. 2004, MNRAS, 347, 497 [NASA ADS] [CrossRef] [Google Scholar]
- Reis, R. C., Wheatley, P. J., Gänsicke, B. T., & Osborne, J. P. 2013, MNRAS, 430, 1994 [NASA ADS] [CrossRef] [EDP Sciences] [Google Scholar]
- Scaringi, S., Bird, A. J., Norton, A. J., et al. 2010, MNRAS, 401, 2207 [NASA ADS] [CrossRef] [Google Scholar]
- Schwarzenberg-Czerny, A. 1989, MNRAS, 241, 153 [NASA ADS] [CrossRef] [Google Scholar]
- Schwope, A. D., Hasinger, G., Lehmann, I., Schwarz, R., & Brunner, H. 2000, Astron. Nachr., 321, 1 [NASA ADS] [CrossRef] [Google Scholar]
- Schwope, A. D., Brunner, H., Hambaryan, V., & Schwarz, R. 2002, in The Physics of Cataclysmic Variables and Related Objects, eds. B. T. Gänsicke, K. Beuermann, & K. Reinsch, ASP Conf. Ser., 261, 102 [Google Scholar]
- Schwope, A. D., Nebot Gomez-Moran, A., Schreiber, M. R., & Gänsicke, B. T. 2009, A&A, 500, 867 [NASA ADS] [CrossRef] [EDP Sciences] [Google Scholar]
- Shara, M. M., Livio, M., Moffat, A. F. J., & Orio, M. 1986, ApJ, 311, 163 [NASA ADS] [CrossRef] [Google Scholar]
- Strassmeier, K. G., Granzer, T., Weber, M., et al. 2004, Astron. Nachr., 325, 527 [NASA ADS] [CrossRef] [Google Scholar]
- Thorstensen, J. R., Schwarz, R., Schwope, A. D., et al. 2009, PASP, 121, 465 [NASA ADS] [CrossRef] [Google Scholar]
- Townsley, D. M., & Gänsicke, B. T. 2009, ApJ, 693, 1007 [NASA ADS] [CrossRef] [Google Scholar]
- Vogel, J., Schwope, A. D., & Gänsicke, B. T. 2007, A&A, 464, 647 [NASA ADS] [CrossRef] [EDP Sciences] [Google Scholar]
- Vogel, J., Schwope, A. D., & Schwarz, R. 2011, A&A, 530, A117 [NASA ADS] [CrossRef] [EDP Sciences] [Google Scholar]
- Weber, M., Granzer, T., & Strassmeier, K. G. 2012, SPIE Conf. Ser., 8451 [Google Scholar]
All Tables
Fit statistics and fit parameters of the spectral models applied to the mean orbital EPIC X-ray spectrum of V405 Peg.
All Figures
|
Fig. 1 Background-subtracted X-ray and UV light curves of V405 Peg obtained with XMM-Newton on Dec. 29, 2009. The data were binned using a bin size of 100 s. They are shown in original time sequence with time transformed to binary phase using the ephemeris of Thorstensen et al. (2009). Phase zero refers to the inferior conjunction of the secondary star. |
| In the text | |
|
Fig. 2 Phase-averaged XMM-Newton X-ray and UV light curves of V405 Peg with a phase resolution of 0.05 phase units. All data are shown twice for easier recognition of repeated features. |
| In the text | |
|
Fig. 3 Hardness ratio vs. soft count-rate of the phase-averaged EPIC-pn data in 20 phase bins. For definitions of soft and hard bands see text. |
| In the text | |
|
Fig. 4 STELLA/WiFSIP differential photometry obtained in July 2012 using an SDSS g-filter. |
| In the text | |
|
Fig. 5 Lomb-Scargle periodogram of de-trended EPIC-pn data (boxcar mean subtracted). |
| In the text | |
|
Fig. 6 Results of the Z2 search (EPIC-pn data, P = 0.1468−54 000 s). The frequency range is Δν ~ 6.8 Hz, the energy band is 0.2 − 7 keV and the size of the extraction region is 10″, amounting to ~13 500 counts. Dashed horizontal lines show confidence levels of 1σ to 4σ for the detection of a periodic signal, given the frequency range, the duration of the observation and the number of source photons in the search. For plotting purposes, a logarithmic step in frequency was adopted, resulting in a smaller number of frequency trials than in the original search (of the order of 3.4 × 10⁶ data points). No significant periodicity with pulsed fraction higher than ~5% (1σ) is found. |
| In the text | |
|
Fig. 7 Mean orbital X-ray spectrum of V405 Peg (EPIC-pn and -MOS) with best-fitting MKCFLOW model superposed, using MEKAL components. |
| In the text | |
|
Fig. 8 Infrared to X-ray spectral energy distribution of V405 Peg. Photometric data were obtained with WISE and 2MASS (black filled squares), the SDSS (green squares), UVOT (magenta rhombs, data obtained through one OBSID are connected by lines), the OM (black rhombs), and GALEX (black squares). Observed spectra are obtained from the SDSS (high state optical), the HST archive (high-state ultraviolet), and from Thorstensen et al. (2009; low-state optical). For model spectra see text. In the X-ray spectral regime spectra are shown obtained with XMM-Newton (black line), Swift (magenta, high state spectrum obtained 2012-10-30, low state 2008-06-04; for the latter spectral shape was not measured, but assumed to be the same as in the high state for illustration purposes), and ROSAT (cyan squares). |
| In the text | |
|
Fig. 9 Magnetic and non-magnetic CVs in the LX − Porb and the LX − D planes. Luminosities, periods and distances were taken from Pretorius & Knigge (2012), Pretorius et al. (2013), Reis et al. (2013), Byckling et al. (2010), and Baskill et al. (2005). Luminosities given in certain spectral bands were corrected with bolometric correction factors using the spectral parameters given in the papers mentioned. The black larger symbol indicates the XMM-Newton observation of V405 Peg, whereas the bars crossing it indicate the range of luminosities as observed with Swift. Diagonal lines in the right panel indicate the survey limits of the RBS and with eROSITA. |
| In the text | |
Current usage metrics show cumulative count of Article Views (full-text article views including HTML views, PDF and ePub downloads, according to the available data) and Abstracts Views on Vision4Press platform.
Data correspond to usage on the plateform after 2015. The current usage metrics is available 48-96 hours after online publication and is updated daily on week days.
Initial download of the metrics may take a while.