Fig. 8
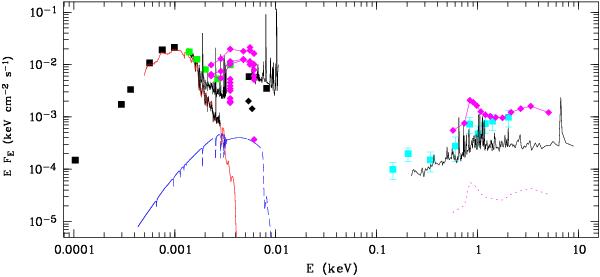
Infrared to X-ray spectral energy distribution of V405 Peg. Photometric data were obtained with WISE and 2MASS (black filled squares), the SDSS (green squares), UVOT (magenta rhombs, data obtained through one OBSID are connected by lines), the OM (black rhombs), and GALEX (black squares). Observed spectra are obtained from the SDSS (high state optical), the HST archive (high-state ultraviolet), and from Thorstensen et al. (2009; low-state optical). For model spectra see text. In the X-ray spectral regime spectra are shown obtained with XMM-Newton (black line), Swift (magenta, high state spectrum obtained 2012-10-30, low state 2008-06-04; for the latter spectral shape was not measured, but assumed to be the same as in the high state for illustration purposes), and ROSAT (cyan squares).
Current usage metrics show cumulative count of Article Views (full-text article views including HTML views, PDF and ePub downloads, according to the available data) and Abstracts Views on Vision4Press platform.
Data correspond to usage on the plateform after 2015. The current usage metrics is available 48-96 hours after online publication and is updated daily on week days.
Initial download of the metrics may take a while.