Fig. 10
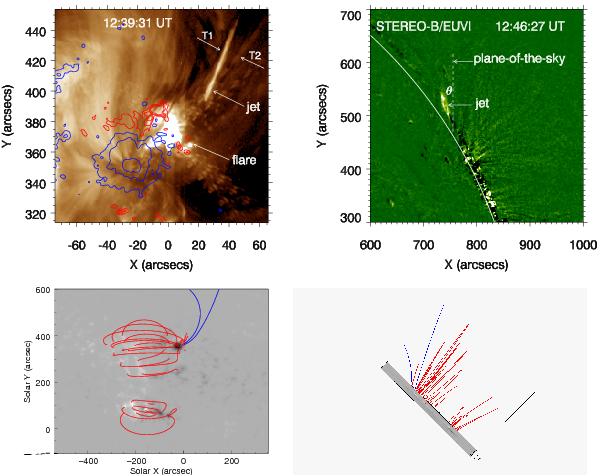
Top left: AIA 193 Å image at 12:39:31 UT that features the jet threads (T1 and T2) and flare as indicated by the white arrows. The red/blue lines stand for the contours of positive and negative polarities of the HMI LOS magnetogram at 12:39:32 UT. Top right: running-difference image of STEREO-B/EUVI in 195 Å at 12:46:27 UT, showing the top segment of the jet. The dashed line stands for the projection of the plane-of-the-sky on the EUV image. The angle included between the jet and plane-of-the-sky is labeled with θ. Bottom panels: top view (left) and side view (right) of the 3D magnetic field lines. The red/blue lines represent closed/open magnetic field lines.
Current usage metrics show cumulative count of Article Views (full-text article views including HTML views, PDF and ePub downloads, according to the available data) and Abstracts Views on Vision4Press platform.
Data correspond to usage on the plateform after 2015. The current usage metrics is available 48-96 hours after online publication and is updated daily on week days.
Initial download of the metrics may take a while.