Fig. 1
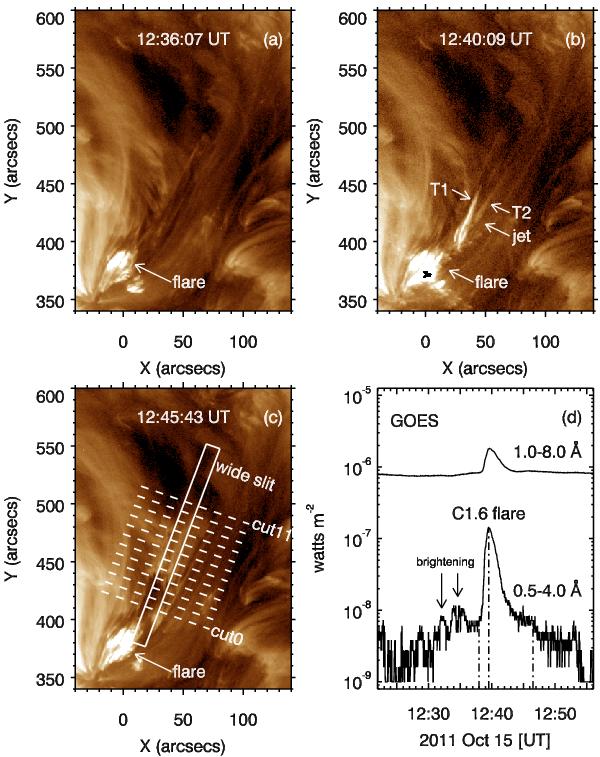
(Movie online) a)−c) Three snapshots of the 193 Å images. The white arrows point to the flare and jet. In panel b), the two thick threads of the jet are labeled “T1” and “T2”. In panel c), the solid box and dashed lines represent the wide slit and 12 narrow slits (cut0−cut11), respectively. d) GOES light curves in 1−8 Å (upper) and 0.5−4.0 Å (lower), featuring the C1.6 flare and weak precursor brightenings. The dash-dotted lines denote the start (12:38:00 UT) and peak (12:39:30 UT) of the flare impulsive phase and end (12:46:30 UT) of the main phase. The temporal evolution is shown in a movie with a larger field of view available in the online edition.
Current usage metrics show cumulative count of Article Views (full-text article views including HTML views, PDF and ePub downloads, according to the available data) and Abstracts Views on Vision4Press platform.
Data correspond to usage on the plateform after 2015. The current usage metrics is available 48-96 hours after online publication and is updated daily on week days.
Initial download of the metrics may take a while.