Fig. 6
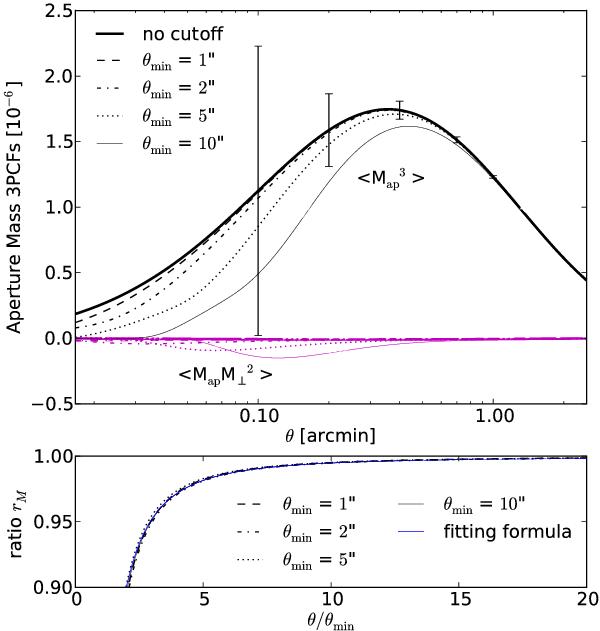
E-/B-mode mixing with three-point aperture mass statistics due to small-scale cutoff at θmin = 1, 2 and 5 arcsec. In the upper panel, the black lines represent the E-mode aperture mass statistic  , and the magenta lines represent the parity-preserving B-mode
  . The error bars present the shape noise contribution to the uncertainty in at θ = 0.1,0.2,0.4,0.7, and 1 arcmin. To compute the shape noise we have adopted an ellipticity dispersion σϵ = 0.35, a galaxy number density n = 30 arcmin-2, and a survey area of 15 000 deg2, which are typical values for the Euclid survey. The lower panel presents the relative decrease in signal when a small-scale information loss is present. All ratios
  follow the same curve when plotted against θ / θmin. The thin blue line presents a fitting formula of this curve rM = 1 − 1 / (0.8 + 0.2x + 2.3x2 − 0.04x3) with x = θ / θmin. The parity-violating B-mode signals, which are not explicitly shown in the figure, are zero over all angular scales, both with and without cutoff.
Current usage metrics show cumulative count of Article Views (full-text article views including HTML views, PDF and ePub downloads, according to the available data) and Abstracts Views on Vision4Press platform.
Data correspond to usage on the plateform after 2015. The current usage metrics is available 48-96 hours after online publication and is updated daily on week days.
Initial download of the metrics may take a while.