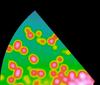
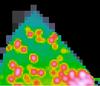
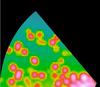
Fig. 6

Illustration on how the density dispersion criterion qmax solves the problem of sharp edges in models such as the AGN torus. In this example we used an octree grid. The left panel represents a cut through the true dust density in xz plane, and the central panel shows the grid density as obtained without a density dispersion criterion with about 3 million cells. The edges of the torus are clearly poorly resolved. The right panel shows the grid density after adding the density dispersion criterion qmax = 0.99 and a maximum subdivision level of 10. The edges are now extremely well resolved using about 7 million of additional cells.
Current usage metrics show cumulative count of Article Views (full-text article views including HTML views, PDF and ePub downloads, according to the available data) and Abstracts Views on Vision4Press platform.
Data correspond to usage on the plateform after 2015. The current usage metrics is available 48-96 hours after online publication and is updated daily on week days.
Initial download of the metrics may take a while.