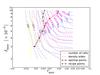
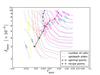
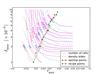
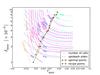
Fig. 3

Contour plots illustrating different properties of octree grids (left panels) and k-d tree grids (right panels), corresponding as a function of the δmax and τmax threshold values. The solid lines in each panel correspond to lines of equal numbers of grid cells, whereas the dashed lines correspond to iso-quality contours, corresponding to the density quality metric Δρ (top panels) and the optical depth quality metric Δτ (bottom panel).
Current usage metrics show cumulative count of Article Views (full-text article views including HTML views, PDF and ePub downloads, according to the available data) and Abstracts Views on Vision4Press platform.
Data correspond to usage on the plateform after 2015. The current usage metrics is available 48-96 hours after online publication and is updated daily on week days.
Initial download of the metrics may take a while.