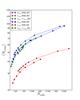
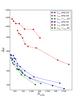
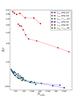
Fig. 2

Comparison of the grid quality metrics for octree (stars) and k-d-tree (dots) based grids of the spiral galaxy model, using different node subdivision stopping criteria. The blue lines correspond to a mass threshold only, the red lines lines to an optical depth threshold only, and the green lines to a combination of both criteria. The different panels represent the average number of cells crossed per path ⟨ Ncross ⟩, the density quality Δρ, and the optical depth quality metric Δτ as a function of the total number of cells in the grid, Ncells.
Current usage metrics show cumulative count of Article Views (full-text article views including HTML views, PDF and ePub downloads, according to the available data) and Abstracts Views on Vision4Press platform.
Data correspond to usage on the plateform after 2015. The current usage metrics is available 48-96 hours after online publication and is updated daily on week days.
Initial download of the metrics may take a while.