Fig. 1
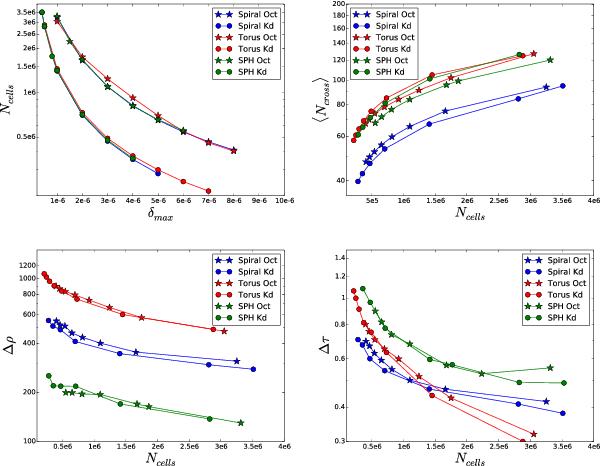
Comparison of the grid quality metrics for octree and k-d-tree based grids of our three test cases (stars correspond to octree grids, dots to k-d tree grids, and the different colours correspond to the three different test models). The top left panel shows Ncells, the total number of cells in the grid, as a function of the threshold mass fraction δmax. For a given threshold value, octree grids require up to more than double the number of cells compared to the corresponding k-d tree. The other panels show the average number of cells crossed per path ⟨ Ncross ⟩, the density quality metric Δρ, and the optical depth quality metric Δτ as a function of Ncells.
Current usage metrics show cumulative count of Article Views (full-text article views including HTML views, PDF and ePub downloads, according to the available data) and Abstracts Views on Vision4Press platform.
Data correspond to usage on the plateform after 2015. The current usage metrics is available 48-96 hours after online publication and is updated daily on week days.
Initial download of the metrics may take a while.