Fig. 7
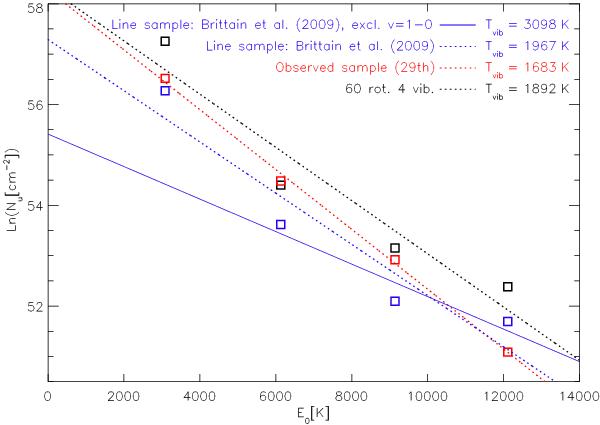
Vibrational diagram from the modelled lines of the lowest four v levels with all 60 rotational levels included. The vibrational diagram from the modelled lines including only those in the sample observed on the 29th is overplotted. We also overplot two vibrational diagrams made using fluxes from our model but line samples equivalent to that used in Brittain et al. (2009). In one we use transitions from the first four v-bands while in the other we exclude the v = 1–0 transitions from the fit. The limited samples have been shifted by a factor of 29.4 for the presentation. The line fluxes used in this plot have not been slit filtered. Observing through a slit at various PA just shifts all the fluxes by the same constant factor and does not change the fitted Tvib substantially.
Current usage metrics show cumulative count of Article Views (full-text article views including HTML views, PDF and ePub downloads, according to the available data) and Abstracts Views on Vision4Press platform.
Data correspond to usage on the plateform after 2015. The current usage metrics is available 48-96 hours after online publication and is updated daily on week days.
Initial download of the metrics may take a while.