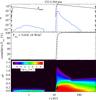
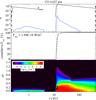
Fig. 5
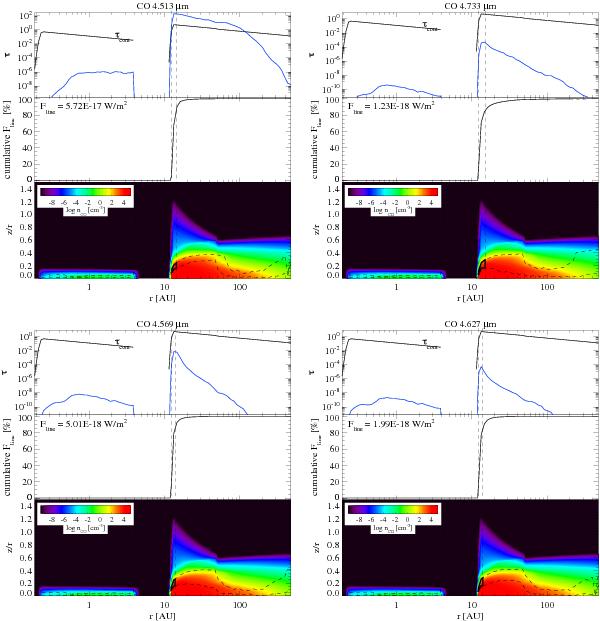
Four different CO ro-vibrational transitions, from top left to bottom right: v(1–0)R20, v(2–1)P1, v(2–1)R20, and v(3–2)R20. In each of the three panels, the optical depth, τ, of the line (blue) and the continuum (black) (upper panel), the radial cumulative line flux (middle panel), and the CO density (bottom panel) are shown. The vertical dashed lines through all three panels show the radial region where 70% of the line flux originates (calculated from vertical escape probability).


Current usage metrics show cumulative count of Article Views (full-text article views including HTML views, PDF and ePub downloads, according to the available data) and Abstracts Views on Vision4Press platform.
Data correspond to usage on the plateform after 2015. The current usage metrics is available 48-96 hours after online publication and is updated daily on week days.
Initial download of the metrics may take a while.