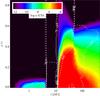
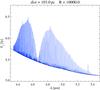
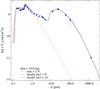
Fig. 4
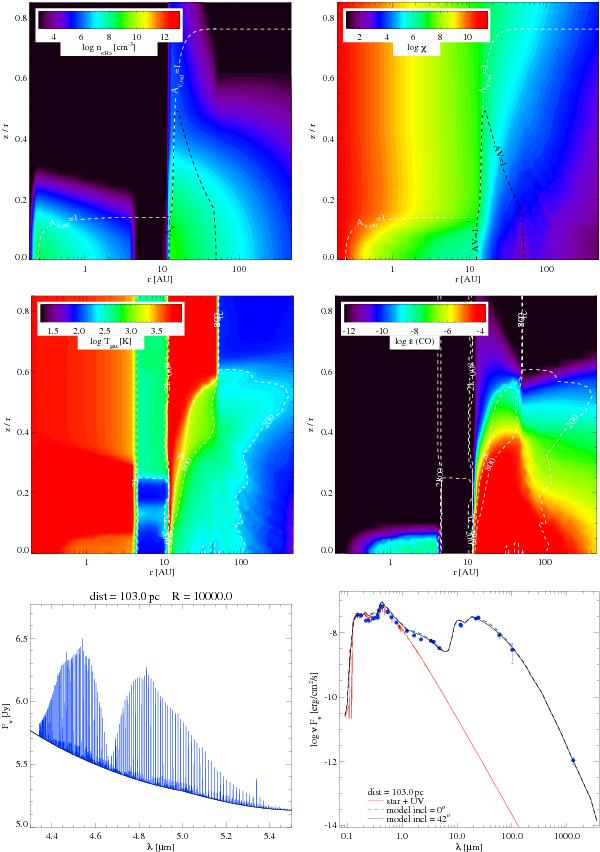
Top: gas density distribution on the left and strength of the UV radiation field log (χ), on the right. Contour lines showing Av,rad = 1.0 (white) and min(Av,ver, Av,rad) = 1.0 (black) are overplotted on both. Middle: gas temperature on the left and CO abundance on the right. Contour lines showing the gas temperatures of 200 K, 800 K, and 2k = 2000 K (the temperatures in the gap should reflect those in a very low density ISM medium) are overplotted on both. Lower left: the ro-vibrational bands of the CO molecule. Lower right: the modelled SED with observational data overplotted as blue dots.
Current usage metrics show cumulative count of Article Views (full-text article views including HTML views, PDF and ePub downloads, according to the available data) and Abstracts Views on Vision4Press platform.
Data correspond to usage on the plateform after 2015. The current usage metrics is available 48-96 hours after online publication and is updated daily on week days.
Initial download of the metrics may take a while.