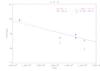
Fig. B.2
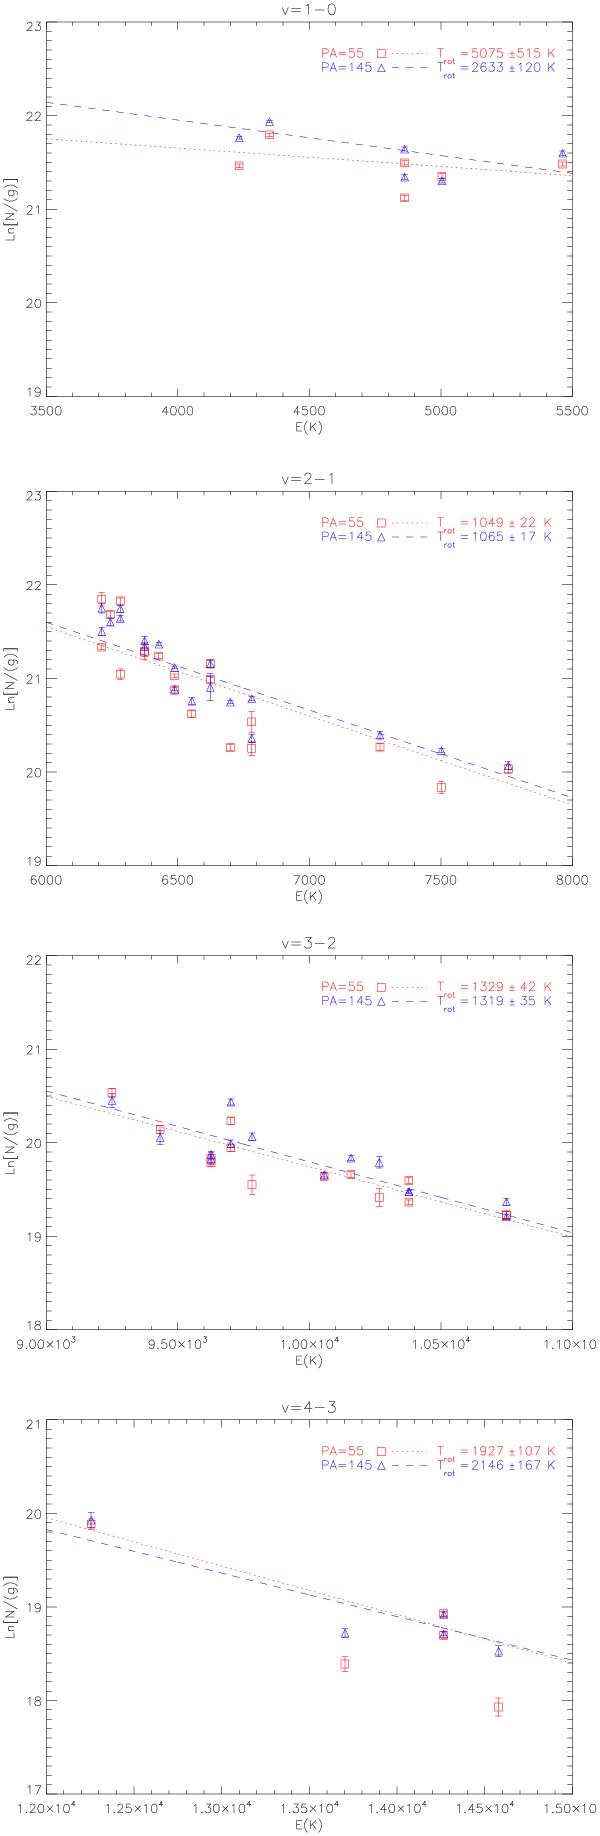
Rotational diagram for each of the first four v levels made from observational data gathered on the 29th. In each plot, data from two position angles are plotted for comparison (PA = 55° shown as red squares and PA = 145° shown as blue triangles). A linear fit to find Trot is made separately for each PA The fitted values are printed on the plots together with their formal error bars. However, we expect a somewhat larger error from the limited J range.
Current usage metrics show cumulative count of Article Views (full-text article views including HTML views, PDF and ePub downloads, according to the available data) and Abstracts Views on Vision4Press platform.
Data correspond to usage on the plateform after 2015. The current usage metrics is available 48-96 hours after online publication and is updated daily on week days.
Initial download of the metrics may take a while.