Fig. B.1
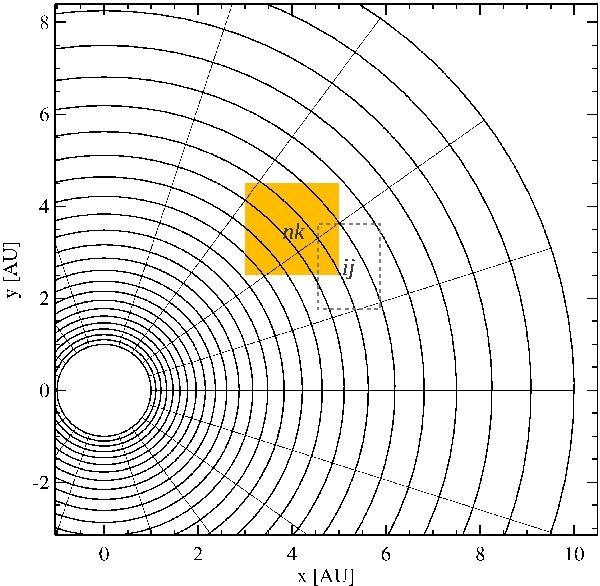
Conversion from polar intensities
Iν(r,θ) to a
regular Cartesian grid  . The
ri and
θj grid points are drawn as black
lines, the yellow box represents a regular image pixel between Cartesian grid
points xn and
yk. The dashed box shows the
construction of a rectangle that exactly contains the polar cell
(i,j).
. The
ri and
θj grid points are drawn as black
lines, the yellow box represents a regular image pixel between Cartesian grid
points xn and
yk. The dashed box shows the
construction of a rectangle that exactly contains the polar cell
(i,j).
Current usage metrics show cumulative count of Article Views (full-text article views including HTML views, PDF and ePub downloads, according to the available data) and Abstracts Views on Vision4Press platform.
Data correspond to usage on the plateform after 2015. The current usage metrics is available 48-96 hours after online publication and is updated daily on week days.
Initial download of the metrics may take a while.