Fig. 5
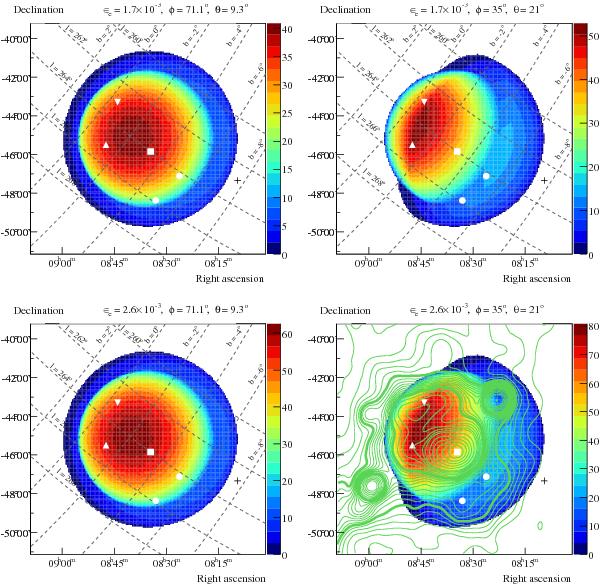
Simulated brightness temperature maps at 408 MHz in equatorial coordinates overlaid with galactic coordinates. Maps are calculated for ϵe = 1.7 × 10⁻³ (upper panels) and ϵe = 2.6 × 10⁻³ (lower panels). Two sets of rotation angles are considered: most probable values φ = 71.1°, θ = 9.3° (left panels) and values that best describe observational data φ = 35°, θ = 21° (right panels). The colour reflects the brightness temperature in K. The angular resolution of the modelled brightness temperature distributions is 4′. In each map white down- and up-pointing triangles denote peak locations of Vela Y an Vela Z, respectively; two white circles show locations of two peaks of Vela W; a white square denotes the position of the Vela X peak (Alvarez et al. 2001); and a cross reflects the location of γ2 Velorum. The bottom right map represents “the best-fit” scenario; it is overlaid with observed 408 MHz radio contours with 51′ angular resolution from Haslam et al. (1982). The contours represent the brightness temperature in K and the steps are 4 K from 40 K to 100 K, 10 K from 100 K to 150 K, and 25 K farther on; the contours of 60 and 100 K are shown with the bold lines. Unlike the map presented in Alvarez et al. (2001), here the galactic background is not removed, which explains the difference in values of the brightness temperature. Alvarez et al. (2001) adopted two background temperatures of 50 K and 60 K at 408 MHz. Besides Vela X in the centre, additional prominent sources (RCW 38 (α = 08h59m,δ = −47°32′) and Puppis A (α = 08h23m,δ = −42°42′)) and weaker compact sources (RCW 36, RCW 33, and RCW 27, clockwise along the NE-north surface) are visible.
Current usage metrics show cumulative count of Article Views (full-text article views including HTML views, PDF and ePub downloads, according to the available data) and Abstracts Views on Vision4Press platform.
Data correspond to usage on the plateform after 2015. The current usage metrics is available 48-96 hours after online publication and is updated daily on week days.
Initial download of the metrics may take a while.