Free Access
Fig. 3
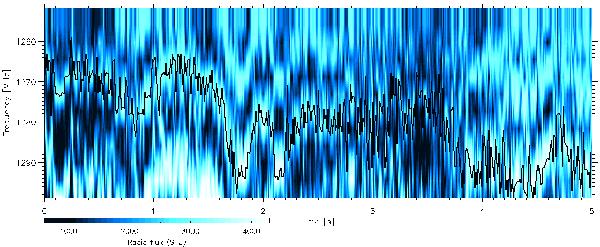
Zebra pattern observed on August 1, 2010 at 08:21:01–08:21:06 UT by the Ondřejov radiospectrograph. This is the enlarged spectrum in the time interval corresponding to short white horizontal bar 2 in Fig. 1. The full line shows the computed frequency variations.
Current usage metrics show cumulative count of Article Views (full-text article views including HTML views, PDF and ePub downloads, according to the available data) and Abstracts Views on Vision4Press platform.
Data correspond to usage on the plateform after 2015. The current usage metrics is available 48-96 hours after online publication and is updated daily on week days.
Initial download of the metrics may take a while.