| Issue |
A&A
Volume 561, January 2014
|
|
|---|---|---|
| Article Number | A81 | |
| Number of page(s) | 7 | |
| Section | Interstellar and circumstellar matter | |
| DOI | https://doi.org/10.1051/0004-6361/201322530 | |
| Published online | 03 January 2014 | |
Near- and mid-IR morphology of the water maser emitting planetary nebula K 3-35⋆
1
Instituto de Astrofísica de Andalucía (IAA-CSIC),
Glorieta de la Astronomía S/N,
18008
Granada,
Spain
e-mail: This email address is being protected from spambots. You need JavaScript enabled to view it.
; This email address is being protected from spambots. You need JavaScript enabled to view it.
2
Universidade de Vigo, Departamento de Física aplicada, Facultade
de Ciencias, Campus
Lagoas-Marcosende s/n, 36310
Vigo,
Spain
e-mail:
This email address is being protected from spambots. You need JavaScript enabled to view it.
3
Consejo Superior de Investigaciones Científicas (CSIC), C/ Serrano
117, 28006
Madrid,
Spain
4
Cornell University, Astronomy Department,
Ithaca, NY
14853-6801,
USA
e-mail:
This email address is being protected from spambots. You need JavaScript enabled to view it.
5
Laboratoire Lagrange, UMR7293, Université de Nice
Sophia-Antipolis, CNRS, Observatoire de la Côte d’Azur, 06300
Nice,
France
e-mail:
This email address is being protected from spambots. You need JavaScript enabled to view it.
Received: 23 August 2013
Accepted: 20 October 2013
Abstract
The shaping process of planetary nebulae (PNe) takes place during the short transition from the asymptotic giant branch (AGB) phase to the white dwarf stage. The young PN K 3-35 represents a unique case where a small-sized water maser ring has been linked to the launch of collimated outflows that shape the nebula. The contrasting optical and radio continuum morphologies of K 3-35 indicate that they disclose different structural components that are apparently unconnected. To bridge the gap between optical and radio continuum observations, we present here new broadband and narrowband near- and mid-IR images of K 3-35. These images, and their comparison with optical and radio continuum images, are revealing. The radio continuum and mid-IR images are dominated by a compact source at the core of K 3-35 whose emission gives evidence of very dense ionized material embedded within a dust cocoon. The emission from the core, obscured at optical wavelengths, is faintly detected in the Ks band. We suggest that the dust may shield the water molecules at the inner ring from the central star ionizing radiation. The precessing collimated outflows, very prominent in radio continuum, are also detected in mid-IR, very particularly in the [S iv] image. The mid-IR emission from these outflows consist mostly of ionized material, although the broadband filter at 11.85 μm seems to imply that a small amount of dust may be carried out by the outflow. The interactions of these outflows with the nebular shell result in shocks that excite the emission of H2 as well as low-excitation lines from ionized species, such as [N ii] at the tips of the outflows.
Key words: ISM: abundances / planetary nebulae: general / planetary nebulae: individual: K 3-35 / ISM: jets and outflows
Based on observations collected at the European Organisation for Astronomical Research in the Southern Hemisphere, Chile. Program: 085.D-0256(A).
© ESO, 2014
1. Introduction
Low- and intermediate-mass stars (0.8 M⊙ < Mi < 8 M⊙) evolve into planetary nebulae (PNe) at the end of their lives. Most of these stars experience dramatic changes when the spherical envelope of an asymptotic giant branch (AGB) stars is transformed into a spectacular bipolar, multipolar or point-symmetric PNe. It has been proposed that disks and tori, whose presence at the core of PNe is suggested by the detection of high-velocity collimated jets, are basic structural components in the shaping of these highly asymmetric PNe (e.g., Balick & Frank 2002). The study of the youngest asymmetrical PNe is fundamental for a better comprehension of the sculpting processes of the material ejected from these stars in the latest phases of their evolution.
One of the first sources revealing the link between disks and collimated outflows is K 3-35, an extremely young PN as indicated by its water maser emission (Miranda et al. 2001). At optical wavelengths, K 3-35 presents bright bipolar lobes split by a prominent dark lane (Miranda et al. 2000; Sahai et al. 2011). The main nebular axis is defined by two bow-shock-like structures ~6′′ apart, oriented along a direction perpendicular to the dark lane. Two bright point-symmetric knots are observed in the bipolar lobes, but the relative orientation of these knots is not coincident with the main nebular axis (Miranda et al. 2000).
Radio observations of K 3-35 have revealed a remarkably different morphology; radio continuum images at 2, 3.6, and 6 cm show a bright precessing bipolar jet emanating from the core and extending up to the bright point-symmetric knots observed at optical wavelengths (Aaquist & Kwok 1990; Aaquist 1993; Miranda et al. 2001). Moreover, observations at 1.3 cm have unveiled the presence of a small disk of radius ~65 AU (assuming a distance of 3.9 kpc to K 3-35, Tafoya et al. 2011) traced by water masers at the center of the object (Miranda et al. 2001; Uscanga et al. 2008). The disk is not totally perpendicular to the main nebular axis of K 3-35, but to the innermost regions of the bipolar jet (Uscanga et al. 2008), suggesting a physical connection between the disk and the jet. Furthermore, the high degree of circular polarization detected in the 1665 and 1720 MHz OH maser emission indicates that the disk is magnetized (Gómez et al. 2009). Water maser emission has also been detected at the tips of the bipolar jet, in spatial coincidence with the bright optical knots (Miranda et al. 2001). The detection of CO and HCO+ from K 3-35 indicates the presence of molecular material (Dayal & Bieging 1996; Tafoya et al. 2011; Gómez et al. 2008). In particular, the detection of HCO+ reveals the existence of dense neutral regions that could preserve and shield the water molecules in the nebula from the strong UV radiation of the central star, although the spatial correspondence between the HCO+ and water maser emitting regions has not been established so far.
The previous studies of K 3-35 have shown notable discrepancies between the optical and radio continuum morphologies, being almost complementary. While the optical observations trace structures produced by scattered light and ionized gas whose emission is strongly absorbed by dust, the radio continuum observations maps emission from ionized gas at the innermost regions of K 3-35 that eludes the absorption of dust. On the other hand, molecular observations (CO, HCO+) show the existence of neutral material, although the morphology of this component is unknown.
Observations of K 3-35 in the near- and mid-infrared can be used to bridge the optical and radio (continuum and molecular) observations. Near-IR observations provide the first insights into the dust thermal emission, and may also trace both ionized gas (e.g., Brγ line emission) and molecular emission (e.g., H2 emission). In the mid-IR, the N-band is expected to be dominated by thermal dust emission, but important contributions from unidentified infrared (UIR) bands commonly attributed to polycyclic aromatic hydrocarbons (PAHs) may be present. Spectral features from silicates and emission lines of ionized species (e.g., [S iv] λ10.50 μm, [Ne ii] λ12.81 μm, and [Ar v] λ13.10 μm) may also be detected in this band (Rinehart et al. 2002).
In this paper, we present new high angular resolution N-band images and narrow and broadband near-IR images of K 3-35, complemented by mid-IR spectroscopic observations to analyze and investigate the nature of the structures detected at these wavelengths. We compared the near- and mid-IR images with high-resolution optical and radio continuum images to gain a better view of a PN in the very first stages of its formation.
2. Observations
2.1. Mid-IR observations
We obtained high angular resolution observations of K 3-35 on September 9, 2010 at the UT3 (Melipal) Very Large Telescope (VLT), using the VLT Imager and Spectrometer for mid-InfraRed (VISIR, Lagage et al. 2004) during the observing program 085.D-0256(A). Near-diffraction images ( ) were acquired in the so-called “normal” observing mode in three different N-band filters: PAH1 (λc = 8.54 μm, half band width HBW = 0.42 μm), [S iv] (λc = 10.49 μm, HBW = 0.16 μm), and SiC (λc = 11.85 μm, HBW = 2.34 μm). Chopping and nodding standard techniques were used to remove the background signal with parallel chop-throw of 10′′. The pixel scale of the detector, a 256 × 256 pixels DRS (former Boeing) device, is 0
 075, resulting in a field of view of 192 × 192. We performed an observation of a standard star after every science observation for deconvolution and flux calibration purposes. We used the standard routines provided by the Gasgano pipeline (version 3.4.4.) for the data reduction of the raw VISIR data cubes. These routines carry out the flat-field correction, bad pixel removal, source alignment, and coaddition of frames. The final images were deconvolved using a Richardson-Lucy algorithm (Richardson 1972; Lucy 1974) with the number of iterations between 20 and 30 to enhance those morphological features already present in the raw data. The resolution of the deconvolved images is ~024, ~031, and ~027 in the PAH, [S iv], and SiC filters, respectively.
2.2. Broad-band near-IR observations
Broad-band J, H and Ks images of K 3-35 were obtained on June 28, 2010, using the Long-Slit Intermediate Resolution Infrared Spectrograph (LIRIS, Acosta Pulido et al. 2003) attached to the Cassegrain focus of the 4.2 m William Herschel Telescope (WHT) of the ORM (Observatorio de El Roque de los Muchachos, La Palma, Spain). The detector was a HAWAII array with a plate scale of 025 pixel-1 and a 47 × 47 field of view. The data were reduced using the dedicated software LIRIS Data Reduction package (LIRISDR), a pipeline for the automatic reduction of near-IR data developed within the Image Reduction and Analysis Facility (IRAF) environment. The reduction by LIRISDR includes standard and additional nonstandard steps, such as bad pixel mapping, cross-talk correction, flat-fielding, sky subtraction, removal of reset anomaly effect, field distortion correction, and final image shift and coaddition. The angular resolution achieved by these observations is ~07.
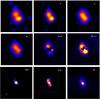 |
Fig. 1 Images of K 3-35 from near-IR (WHT LIRIS J, H, and Kc and TNG NICS H2, H2-Kc, and Brγ-Kc) to mid-IR (VLT VISIR PAH1 λ8.6 μm, [S iv] λ10.49 μm, and SiC λ11.85 μm). The images are displayed in logarithmic scale to enhance the morphological characteristics. The spatial scale, as is indicated in the PAH1 image, is the same for all images. North is up, east to the left. |
2.3. Narrowband near-IR observations
We acquired narrowband near-IR images of K 3-35 on September 19, 2003 with the Near-Infrared Camera Spectrometer (NICS) attached to the Telescopio Nazionale Galileo (TNG) at the ORM and were used by Miranda et al. (2007) for a preliminary analysis of the near-IR morphology of this object. The detector was a Rockwell HgCdTe Hawaii array with 1024 × 1024 pixels. We used the small field (SF) camera of NICS, which provides a plate scale of 013 pixels-1. Three narrowband filters in the K band were used: H2 (λ0 = 2.122 μm, FWHM = 0.032 μm), Brγ (λ0 = 2.169 μm, FWHM = 0.035 μm), and a continuum filter, Kc (λ0 = 2.275 μm, FWHM = 0.039 μm). Several exposures were obtained with the nebula centered in each quadrant of the detector for total exposure times of 1440 s per filter. We have reduced the data using standard procedures within the MIDAS package. The angular resolution of the H2, Brγ, and Kc images is ~059, ~071, and ~067, respectively.
2.4. The ISO SWS spectrum
We used Infrared Space Observatory ISO spectral processed and normalized data (Sloan et al. 2003) from the Short Wavelength Spectrometer (SWS; de Graauw et al. 1996) available in the ISO database. This spectrometer operates between 2.4 and 45 μm with aperture sizes of 14 × 20 arcsec2 for λ = 2.38−12.1 μm and 20 × 22 arcsec2 between λ = 12−29 μm. In this paper, we used data from 8 μm to 14 μm obtained on November 25, 2001 (Proposal ID: SAHAI_1) to investigate the nature of the emission of K 3-35 in the N-band.
3. Results
Next, we describe the new images, shown in Fig. 1, of K 3-35 obtained through narrowband and broadband near- and mid-IR filters. To study the multi-wavelength spatial distribution of the emission of K 3-35, we also use VLA radio continuum data at 3.6 cm from Miranda et al. (2001) and HST WFPC2 F658N [N ii], F606W R, and F814W I images downloaded from the Mikulski Archive for Space Telescopes (MAST) (Program 9101, P.I.: Sahai). This allows us to emphasize the notable morphological differences and similarities between the nebular emission in the optical, IR, and radio domains.
The emission in the mid-IR N-band is dominated by a bright, compact source at the center of K 3-35 (Fig. 1, bottom row), which will be referred hereafter as to the core of K 3-35. We note that the core of K 3-35 remains unresolved at the spatial resolution of 03 achieved by the VISIR observations. The intensity of the emission from the innermost regions of K 3-35 increases toward redder wavelengths. Most of the emission detected in the narrow PAH1 filter arises in the core, with very faint extensions detected at PA ~ 45°. The broad-band 11.85 μm image reveals additional extended emission that traces narrow and elongated structures emanating from the core and extending up to ~08 along PA ~ 31°. These features are better defined in the image through the [S iv] filter. In this filter, the emission of these two structures is prominent, revealing an S-shape that closely ressembles the bipolar precessing jet observed at 3.6 cm radio continuum.
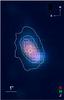 |
Fig. 2 JHK color composite image of K 3-35 with SiC logarithmic contours overplotted to improve the morphological characteristics of this PN. The SiC image has been degraded to the resolution of the JHK image. |
The LIRIS broad-band near-IR images (Fig. 1, top row) disclose contrasting morphologies as they probe emission in the different bands. The spatial distribution of the extended emission in the J and H bands is alike: the emission peaks in two blobs ~16 apart bisected by an obscured region at the equatorial plane of K 3-35. These two blobs correspond with the bright point-symmetric knots detected in optical images. The northeastern blob at PA ~ 31° is fainter than the southwestern blob at PA ~ 220°, in contrast with the optical wavelengths that reveal the northeastern knot to be brighter. Nevertheless, we note a field star superimposed on the southwestern lobe whose contribution to the brightness in the J and H bands of the southwestern lobe may be responsible for this discrepancy.
Very remarkably, the emission in the Ks band peaks at the core of K 3-35. This is in agreement with the emission shown in the N-band images, although contrary to the N-band, the Ks image is not dominated by the emission from the core (see Figs. 1 and 2). We must emphasize that the Ks band marks the shortest wavelength at which the innermost regions of K 3-35 is faintly detected.
The morphology in the Ks image therefore shows structural components seen in the J and H images as well as those seen in the N-band images, thus reconciling the distinct morphologies observed in the near- and mid-IR.
Figure 1 (middle row) also presents the narrowband near-IR images obtained with NICS at the TNG. In particular, we show the H2 image and the continuum-subtracted H2-Kc and Brγ-Kc images isolating the molecular and ionized emissions1. The H2 emission appears over the tips and beyond the bipolar blobs observed in the mid-IR images, along an axis oriented at PA ~ 27° and at angular distances of ~11 from the core of K 3-35. The emission is brighter at the northeastern lobe, as highlighted by the H2-Kc image. The spatial distribution of the ionized material traced by the Brγ line resembles that described for H2, but the emission is more extended, it seems to enclose the equatorial region and, contrary to the H2 emission, it peaks in the southwestern lobe at PA ~ 215°. We caution that the contribution from a field star superimposed on the southwestern lobe may alter this conclusion. The northeast peak of the Brγ emission is oriented at PA ~ 26° and at a distance of ~08 from the core, i.e., closer to the core than the corresponding peak of H2 emission.
The comparison of the IR images with previous high angular resolution VLA radio continuum maps (Fig. 3) and HST WFPC2 optical observations (Fig. 4) reveals important spatial coincidences between the different morphological components of K 3-35. The 3.6 cm radio continuum image in Fig. 3 shows a bright core and extended emission along the S-shaped precessing bipolar jet. The tips of the bipolar jet are spatially coincident with regions of enhanced H2 emission (see left panel of Fig. 3), but neither the core nor the collimated outflows themselves are detected in the narrowband near-IR H2 or Brγ images; only the Ks band detects the core observed at 3.6 cm (Fig. 2). On the other hand, there is a close correspondence between the radio 3.6 cm and mid-IR [S iv] images (see right panel of Fig. 3). At these two wavelengths, the emission from the core is bright, but there is a prominent S-shaped feature that traces the precessing collimated outflow. There is a perfect match between the morphology of this S-shaped feature at 3.6 cm and the [S iv] filter.
The HST RGB composite picture (Fig. 4), which traces the ionized material detected in the [N ii] filter and very likely the contribution of the Hα emission line into the bandpass of the F606W R filter, shows emission from the bipolar lobes and point-symmetric knots of K 3-35. The bow-shock-like features at the tips of the bipolar lobes, ~3′′ from the core of K 3-35, do not have any counterpart in the radio and IR images described so far. On the contrary, the contours overplotted on Fig. 4 indicate that the regions of enhanced H2 and Brγ emission and the tips of the jet seen in radio and [S iv] are coincident with the optically bright point-symmetric knots of the bipolar lobes. Therefore, the H2 emission is mostly detected at the tips of the precessing jet, where the [N ii] and Brγ emissions also peak.
The ISO SWS N-band spectrum is displayed in Fig. 5. It does not show significant emission in the [S iv] 10.50 μm line nor in the [Ne ii] 12.81 μm line, but a continuum emission increasing with wavelength. This continuum emission can be attributed to warm dust. According to Aaquist & Kwok (1989), the IR spectral energy distribution of K 3-35 can be interpreted as a blackbody with temperature of 133 K. It is worth noting that the ISO spectrum is representative of the bright core and not of the bipolar jet observed mainly in the [S iv] filter.
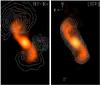 |
Fig. 3 VLA 3.6 cm radio continuum image of K 3-35 overplotted by H2-Kc (left) and [S iv] (right) contours. The spatial scale is indicated in the left panel. The bright point source west of the central core in the continuum-subtracted H2 contours at PA ~ 260° corresponds to a field star not properly subtracted (see text). The contours overplotted are in logarithmic scale to enhance the morphological features detected. |
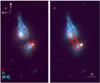 |
Fig. 4 Color-composite HST WFPC2 picture of K 3-35 (I: red, R: green, [N ii]: blue) overplotted by H2-Kc (left) and [S iv] (right) contours. The spatial scale is indicated. The contours overplotted to enhance the morphological featrures are in logarithmic scale. Note that the field of view of this picture is much larger than that of Fig. 3. |
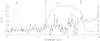 |
Fig. 5 N-band ISO SWS spectrum of K 3-35 with normalized transmission curves of the VISIR filters used in this work: PAH1 in orange, [S iv] in green, and SiC in blue. Photometric data obtained by different space missions are represented by ◇ signs: MSX at 8.28 μm and 12.13 μm, AKARI at 9 μm, IRAS at 12 μm, and WISE at 11.6 μm. The wavelengths of the main features and emission lines in the N-band are labeled and marked by vertical lines. |
4. Discussion
The comparison between the near- and mid-IR images, as well as the VLA 3.6 cm radio continuum and HST optical images of K 3-35 is inspiring. The morphology in the broad-band J and H, and narrowband H2 and Brγ images is similar to that in the HST optical, whereas the mid-IR images are more alike than in the 3.6 cm radio continuum. At this point, the Ks image is key, as it shows morphological features that are common to those observed in the optical and 3.6 cm radio continuum images. Below we discuss the morphological components present in the different images and the nature of these emissions.
The core of K 3-35 is a bright feature in the mid-IR VISIR images, with intensity increasing with wavelength in the N-band, whereas it fades toward shorter wavelengths and falls below detection blueward of the Ks band. This spectral behavior and the presence of a dark lane obscuring the central regions in optical images, imply the presence of warm dust, which is detected through its thermal continuum emission. On the other hand, the detection of radio continuum emission from the core indicates the existence of ionized material at the very center of K 3-35. We, therefore, conclude that the mid-IR emission from the central regions of K 3-35 is thermal emission of dust in a cocoon that embeds the innermost ionized core.
The mid-IR emission in the [S iv] and the broad-band SiC filters from the precessing outflows may have a different origin. To investigate the nature of the emission in these mid-IR filters, in Fig. 6 we compare spatial profiles along the outflows extracted from the 3.6 cm radio continuum, [S iv], and SiC images. The spatial profile of [S iv] matches that of the 3.6 cm radio continuum; both show a bright emission peak encompassed by two shoulders whose position and relative brightness are very similar. The emission peak corresponds to the core, whereas the shoulders correspond to emission from the collimated outflows. In sharp contrast, the SiC profile shows the bright emission peak from the core, but much fainter emission at the position of the collimated outflows. These results suggest that the extended emission in the [S iv] image indeed originates from [S iv] line emission of the ionized material revealed by the radio continuum emission. The lack of [S iv] line emission in the ISO spectrum can be understood as due to the faintness of the collimated outflows in comparison with the emission from the core, which is probably the dominant contribution to the ISO SWS spectrum. Meanwhile, the weak extended emission in the collimated outflows registered by the SiC λ11.85 μm filter may be attributed to dust, thus suggesting that a small amount of dust is present in these structures. This dust component can originate in material from the dust cocoon entrained and carried away by the outflows.
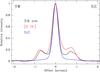 |
Fig. 6 Normalized spatial profiles of the emission observed at 3.6 cm radio continuum, [S iv] and SiC filters along PA = 30°. |
The spatial distribution of the ionized material traced by the optical and near-IR observations is notably distorted by the large extinction toward the central regions of K 3-35. The total extent of the bipolar lobes is only shown in the HST images, whereas their outermost, faintest regions are missed by the near-IR images. The J, H, and Brγ images2 detect emission from the bright spots in the bipolar lobes at the tips of the collimated outflows seen in radio and mid-IR observations. The emission in these broadband near-IR filters may be attributable to the Paschen and Brackett hydrogen emission lines present in the J and H bands. The faint emission in these filters that enclose the central regions indicates an additional contribution of scattered light.
The spatial coincidence between the point-symmetric knots and the H2 bright regions is notorious. The origin of the H2 emission at these positions may be attributed to shocks. Indeed, the spectral properties of these knots strongly suggest that shocks are involved in the emission. In particular, the high [N ii]/Hα intensity ratio, the large range of excitation, and the presence of water maser emission in the point-symmetric knots are indicative of shocks (Miranda et al. 2007). These results provide clear evidence for the existence of neutral material in the point-symmetric knots, as required by the existence of water maser molecules at these positions (see Tafoya et al. 2011). Observations of CO and HCO+ at high angular resolution would be very valuable to test whether these molecules are also associated with the point-symmetric knots and, if so, to study their properties. Moreover, the detection of thermal cold dust toward the core and the collimated outflows of K 3-35 is crucial concerning the existence of water maser molecules. Dust grains absorb most of the UV radiation from the central star, thereby preventing the dissociation of the water molecules. In the case of the core, the radius of the water maser ring (~65 AU; Uscanga et al. 2008) establishes an approximate boundary between the very compact ionized region and the dusty torus, at least along the equatorial plane of K 3-35. Along the perpendicular direction, dust may be swept up and carried outwards by the collimated outflows up to the position of the point-symmetric knots. This would represent another contribution to the neutral material existing in the knots.
The detection of a central dust component veiling the innermost regions of K 3-35 and the distribution of H2O masers on a small disk reinforce the evidence for the existence of a circumstellar molecular torus in K 3-35. This dust component seems critical to allow the survival of molecules such as H2O, H2, or HCO+, despite the strong UV radiation from the central star. Meanwhile, the H2O maser emission and the evidence for shocks at the tips of the radio and mid-IR jet-like features strongly support the presence of a fast collimated outflow that interacts with the nebular envelope. The dusty component of the outflows may imply that these, after emanating from the central regions of K 3-35, have entrained material from these inner regions, thus revealing additional interaction between the fast outflows and the dust cocoon. In these regards, K 3-35 is a notorious case study for models where high-velocity jets and disks are the basic ingredient in the shaping of the most axisymmetric PNe (Morris 1987; Soker 1996; Reyes-Ruiz & López 1999; Sahai & Trauger 1998; Soker & Rappaport 2000; Nordhaus & Blackman 2006; Huggins 2007).
5. Conclusions
We have presented here new broadband and narrowband, near- and mid-IR images of the extremely young PN K 3-35. The data have allowed us to describe the structures observed at IR wavelengths and to compare them with the morphologies seen at optical and radio continuum wavelengths. We complemented these data with ISO SWS mid-IR spectra to assess the nature of the mid-IR emission.
A faint core is detected in the Ks band, while it becomes very bright in the mid-IR. The spectral properties of the core indicate that its mid-IR emission is due to dust. The dust at the core of K 3-35 may shield the water molecules from the ionizing radiation of the central star. Among the three mid-IR images observed in this study, the [S iv] image best shows the bipolar jet previously detected in 3.6 cm radio continuum images. The perfect agreement between the morphologies in the [S iv] and 3.6 cm images of this jet implies that the emission from this feature detected in the [S iv] image is mostly dominated by line emission from ionized material. The jet is also detected in the broadband image at 11.85 μm, but its morphology does not ressemble that produced by ionized material, thus suggesting the presence of dust in the bipolar jet, although less abundantly than at the core.
The near-IR broad-band J and H and narrowband H2 and Brγ images are very similar to those in the optical, mainly tracing line emission from the point-symmetric knots at the tips of the bipolar jet. Shocks in these knots are the most plausible origin for the H2 emission. The acquisition of spectral information in the near- and mid-IR that allow us a reliable temperature diagnostic for the dust and for the nature of the material in the jet that is mandatory to draw firm conclusions concerning the origin of the H2 and mid-IR emissions detected in K 3-35.
The spectral distribution of the core of K 3-35 and that of the stars in the field of view are notably different, and thus those stars could not be used to scale the emission in the continuum filter to that in the line filters. In particular, the star projected on the southwestern lobe is poorly removed in the continuum subtracted images. Furthermore, differences in the PSF of the images (see text) are probably responsible for the apparent circular H2 emission feature around its core.
These images also include the continuum emission from a foreground star southwest of the core of K 3-35.
Acknowledgments
Part of this work was supported by the Ministerio de Economía y Competitividad of Spain through grants AYA 2008-01934, AYA 2008-06189-C03-01, AYA 2011-29754-C03-02, and AYA 2011-30228-CO3-01 cofunded by FEDER funds. MWBC would like to thank the EEBB-FPI for a short-term stay grant and the European Southern Observatory (ESO) Headquarters in Garching, Germany, for all the facilities provided during her stay there in 2011. L.F.M. acknowledges support by grant IN845B-2010/061 of Xunta de Galicia, partially funded by FEDER funds. Based on observations with the Infrared Space Observatory ISO, an ESA project with instruments funded by ESA Member States (especially the PI countries: France, Germany, the Netherlands, and UK) and with the participation of ISAS and NASA. Part of the data presented in this paper were obtained from the Mikulski Archive for Space Telescopes (MAST). STScI is operated by the Association of Universities for Research in Astronomy, Inc., under NASA contract NAS5-26555. Support for MAST for non-HST data is provided by the NASA Office of Space Science via grant NNX09AF08G and by other grants and contracts. We acknowledge an anonymous referee for comments that improved this paper.
References
- Aaquist, O. B. 1993, A&A, 267, 260 [NASA ADS] [Google Scholar]
- Aaquist, O. B., & Kwok, S. 1989, A&A, 222, 227 [NASA ADS] [Google Scholar]
- Aaquist, O. B., & Kwok, S. 1990, A&AS, 84, 229 [NASA ADS] [Google Scholar]
- Acosta Pulido, J. A., Ballesteros, E., Barreto, M., et al. 2003, The Newsletter of the Isaac Newton Group of Telescopes, 7, 15 [Google Scholar]
- Balick, B., & Frank, A. 2002, ARA&A, 40, 439 [NASA ADS] [CrossRef] [Google Scholar]
- Dayal, A, & Bieging, J. H. 1996, ApJ, 472, 703 [NASA ADS] [CrossRef] [Google Scholar]
- de Graauw, T., Haser, L. N., Beintema, D. A., et al. 1996, A&A, 315, L49 [NASA ADS] [Google Scholar]
- Dopita, M. A., & Sutherland, R. S. 2003, Astrophysics of the diffuse universe, (Berlin, New York: Springer), Astronomy and astrophysics library [Google Scholar]
- Gómez, Y., Tafoya, D., Anglada, G., et al. 2008, IAU Symp., 251, 173 [NASA ADS] [CrossRef] [Google Scholar]
- Gómez, Y., Tafoya, D., Anglada, G., et al. 2009, ApJ, 695, 930 [NASA ADS] [CrossRef] [Google Scholar]
- Huggins, P. J. 2007, ApJ, 663, 342 [NASA ADS] [CrossRef] [Google Scholar]
- Lagage, P. O., Pel, J. W., Authier, M., et al. 2004, The Messenger, 117, 12 [NASA ADS] [Google Scholar]
- Lucy, L. B. 1974, AJ, 79, 745 [NASA ADS] [CrossRef] [Google Scholar]
- Miranda, L. F., Fernández, M., Alcalá, J. M., et al. 2000, MNRAS, 311, 748 [NASA ADS] [CrossRef] [Google Scholar]
- Miranda, L. F., Gómez, Y., Anglada, G., & Torrelles, J. M. 2001, Nature, 414, 284 [NASA ADS] [CrossRef] [PubMed] [Google Scholar]
- Miranda, L. F., Luridiana, V., Guerrero, M. A., et al. 2007, in Asymmetrical Planetary Nebulae IV, article 34, http://www.iac.es/proyect/apn4 [Google Scholar]
- Morris, M. 1987, PASP, 99, 1115 [NASA ADS] [CrossRef] [Google Scholar]
- Nordhaus, J., & Blackman, E. G. 2006, MNRAS, 370, 2004 [NASA ADS] [CrossRef] [Google Scholar]
- Reyes-Ruiz, M., & López, J. A. 1999, ApJ, 524, 952 [NASA ADS] [CrossRef] [Google Scholar]
- Richardson, W. H. 1972, J. Opt. Soc. Am., 62, 55 [Google Scholar]
- Rinehart, S. A., Houck, J. R., Smith, J. D., & Wilson, J. C. 2002, MNRAS, 336, 66 [NASA ADS] [CrossRef] [Google Scholar]
- Sahai, R., & Trauger, J. T. 1998, AJ, 116, 1357 [NASA ADS] [CrossRef] [Google Scholar]
- Sahai, R., Morris, M. R., & Villar, G. G. 2011, AJ, 141, 134 [NASA ADS] [CrossRef] [Google Scholar]
- Sloan, G. C., Kraemer, K. E., Price, S. D., & Shipman, R. F. 2003, ApJS, 147, 379 [NASA ADS] [CrossRef] [Google Scholar]
- Soker, N. 1996, ApJ, 468, 774 [NASA ADS] [CrossRef] [Google Scholar]
- Soker, N., & Rappaport, S. 2000, ApJ, 538, 241 [NASA ADS] [CrossRef] [Google Scholar]
- Tafoya, D., Gómez, Y., Anglada, G., et al. 2007, AJ, 133, 364 [NASA ADS] [CrossRef] [Google Scholar]
- Tafoya, D., Imai, H., Gomez, Y., et al. 2011, PASJ, 63, 71 [NASA ADS] [Google Scholar]
- Uscanga, L., Gómez, Y., Raga, A. C., et al. 2008, MNRAS, 390, 1127 [NASA ADS] [CrossRef] [Google Scholar]
All Figures
|
Fig. 1 Images of K 3-35 from near-IR (WHT LIRIS J, H, and Kc and TNG NICS H2, H2-Kc, and Brγ-Kc) to mid-IR (VLT VISIR PAH1 λ8.6 μm, [S iv] λ10.49 μm, and SiC λ11.85 μm). The images are displayed in logarithmic scale to enhance the morphological characteristics. The spatial scale, as is indicated in the PAH1 image, is the same for all images. North is up, east to the left. |
| In the text | |
|
Fig. 2 JHK color composite image of K 3-35 with SiC logarithmic contours overplotted to improve the morphological characteristics of this PN. The SiC image has been degraded to the resolution of the JHK image. |
| In the text | |
|
Fig. 3 VLA 3.6 cm radio continuum image of K 3-35 overplotted by H2-Kc (left) and [S iv] (right) contours. The spatial scale is indicated in the left panel. The bright point source west of the central core in the continuum-subtracted H2 contours at PA ~ 260° corresponds to a field star not properly subtracted (see text). The contours overplotted are in logarithmic scale to enhance the morphological features detected. |
| In the text | |
|
Fig. 4 Color-composite HST WFPC2 picture of K 3-35 (I: red, R: green, [N ii]: blue) overplotted by H2-Kc (left) and [S iv] (right) contours. The spatial scale is indicated. The contours overplotted to enhance the morphological featrures are in logarithmic scale. Note that the field of view of this picture is much larger than that of Fig. 3. |
| In the text | |
|
Fig. 5 N-band ISO SWS spectrum of K 3-35 with normalized transmission curves of the VISIR filters used in this work: PAH1 in orange, [S iv] in green, and SiC in blue. Photometric data obtained by different space missions are represented by ◇ signs: MSX at 8.28 μm and 12.13 μm, AKARI at 9 μm, IRAS at 12 μm, and WISE at 11.6 μm. The wavelengths of the main features and emission lines in the N-band are labeled and marked by vertical lines. |
| In the text | |
|
Fig. 6 Normalized spatial profiles of the emission observed at 3.6 cm radio continuum, [S iv] and SiC filters along PA = 30°. |
| In the text | |
Current usage metrics show cumulative count of Article Views (full-text article views including HTML views, PDF and ePub downloads, according to the available data) and Abstracts Views on Vision4Press platform.
Data correspond to usage on the plateform after 2015. The current usage metrics is available 48-96 hours after online publication and is updated daily on week days.
Initial download of the metrics may take a while.