Fig. 3
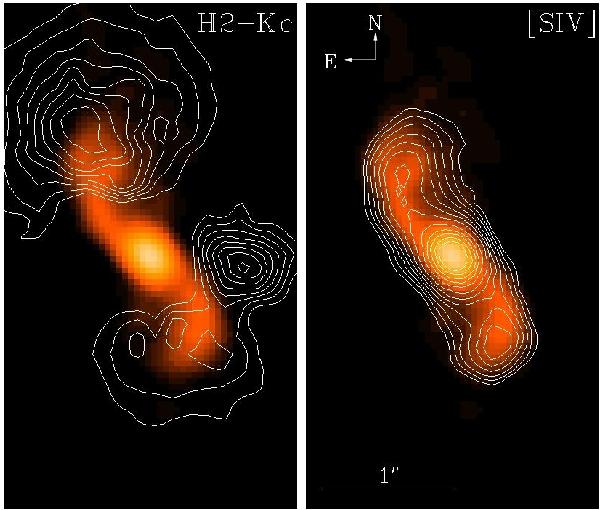
VLA 3.6 cm radio continuum image of K 3-35 overplotted by H2-Kc (left) and [S iv] (right) contours. The spatial scale is indicated in the left panel. The bright point source west of the central core in the continuum-subtracted H2 contours at PA ~ 260° corresponds to a field star not properly subtracted (see text). The contours overplotted are in logarithmic scale to enhance the morphological features detected.
Current usage metrics show cumulative count of Article Views (full-text article views including HTML views, PDF and ePub downloads, according to the available data) and Abstracts Views on Vision4Press platform.
Data correspond to usage on the plateform after 2015. The current usage metrics is available 48-96 hours after online publication and is updated daily on week days.
Initial download of the metrics may take a while.