| Issue |
A&A
Volume 561, January 2014
|
|
|---|---|---|
| Article Number | A52 | |
| Number of page(s) | 11 | |
| Section | Extragalactic astronomy | |
| DOI | https://doi.org/10.1051/0004-6361/201322504 | |
| Published online | 23 December 2013 | |
Spectral index image of the radio halo in the cluster Abell 520, which hosts the famous bow shock
1 Dipartimento di Fisica e Astronomia, Università di Bologna, via Ranzani 1, 40127 Bologna, Italy
e-mail: This email address is being protected from spambots. You need JavaScript enabled to view it.
2 INAF – Istituto di Radioastronomia, via Gobetti 101, 40129 Bologna, Italy
3 INAF – Osservatorio Astronomico di Cagliari, via della Scienza 5, 09047 Selargius (CA), Italy
4 National Radio Astronomy Observatory, Socorro, NM 87801, USA
5 Naval Research Laboratory Remote Sensing Division, Code 7213 4555 Overlook Ave SW, Washington, DC 20375, USA
Received: 19 August 2013
Accepted: 10 October 2013
Abstract
Context. Synchrotron-radio emission has been detected from an increasing number of galaxy clusters. Spectral index images are a powerful tool for investigating the origin and nature of these sources, and their connection with the dynamical state of the cluster.
Aims. The aim of this work is to investigate the spectral index distribution of the radio halo in the galaxy cluster A520, known to be a complex system from an optical, radio, and X-ray point of view.
Methods. We present deep Very Large Array observations in total intensity at 325 and 1400 MHz. We produced and analyzed spectral index images of the radio halo in this frequency range at a resolution of 39′′ and 60′′ and determined possible correlations with the thermal properties of the cluster.
Results. We found an integrated radio-halo spectral index α3251400 ~ 1.12. No strong radial steepening is present and the spectral index distribution is intrinsically complex with fluctuations only partially due to measurement errors. The radio-halo-integrated spectral index and the cluster temperature follow the general trend observed in other galaxy clusters, although a strong point-to-point correlation between the spectral index and the thermal gas temperature has not been observed.
Conclusions. The complex morphology in the spectral index image of the radio halo in A520 agrees with the primary models for radio-halo formation. The flatness of the radial profile suggests that the merger is still ongoing and is uniformly and continuously (re-) accelerating the population of relativistic electrons responsible of the radio emission even at large (~1 Mpc) distances from the cluster center.
Key words: galaxies: clusters: general / galaxies: clusters: individual: Abell 520 / magnetic fields / large-scale structure of Universe
© ESO, 2013
1. Introduction
The formation of massive galaxy clusters can be explained in the context of the hierarchical scenario as caused by the collision and subsequent merger of small galaxy groups and subclusters. These are the most energetic phenomena in the Universe since the Big Bang. Energies as high as ≳1064 ergs (e.g. Sarazin 2002) are released in the form of shocks and turbulence that accelerate particles and compress magnetic field, leading to large-scale diffuse synchrotron sources associated with the intracluster medium (ICM) that are known as radio halos and relics.
Radio halos and relics are faint (~μJy/arcsec2 at 1.4 GHz) sources extended on Mpc scales, located at the center and in the outskirts of about 100 merging galaxy clusters, respectively (see Feretti et al. 2012, for a recent review). The study of radio halos and relics is of paramount importance to shed light on the history and physical properties of galaxy clusters, and to clarify the role of nonthermal components associated to the ICM. Their nature reveals very weak large-scale magnetic fields, with central strengths ~μG, fluctuation scales of up to several hundreds of kpc (e.g. Vacca et al. 2010), and rarefied, very energetic populations of relativistic electrons spread across the cluster volume.
A key tool for investigating the shape of the relativistic electron spectrum and the link between thermal and nonthermal properties in galaxy clusters is the spectral index1 distribution of halos and relics. Spectral index images have been produced so far for just a few radio halos (e.g. Coma, Giovannini et al. 1993; A665 and A2163, Feretti et al. 2004; A3562, Giacintucci et al. 2005; A2744 and A2219, Orrù et al. 2007; A2255, Pizzo & de Bruyn 2009; and A2256, van Weeren et al. 2009; and Kale & Dwarakanath 2010), revealing complex distributions with flattening in the regions directly influenced by ongoing mergers. Investigations of the integrated spectrum of radio halos have been performed as well, for instance, in Coma (Thierbach et al. 2003), A2319 (Feretti et al. 1997), A754 and A1914 (Bacchi et al. 2003), A3562 (Giacintucci et al. 2005), A2256 (Brentjens 2008; Kale & Dwarakanath 2010), and A697 (van Weeren et al. 2011; but see also Venturi et al. 2013). In some cases a steepening at increasing frequencies has been detected (e.g., Coma, A2319, A754, and A3562) that could be due to the Sunyaev-Zel’dovich (SZ) effect (Ensslin 2002; Pfrommer & Ensslin 2004) and/or to strong energy losses in the relativistic electron population. Brunetti et al. (2013) recently showed for the diffuse emission of the Coma cluster that the SZ decrement has no significant impact on the shape of the radio-halo spectrum.
Despite the improvements in the capabilities of present radio interferometers and in the analysis procedures, a number of questions concerning the radio-halo origin and evolution are still open. A mechanism of (re-) acceleration of relativistic electrons (primary models, e.g. Brunetti et al. 2009) or in situ generation (secondary models, e.g. Ensslin et al. 2011) is required to explain their emission over Mpc scales. Observational properties of radio halos, for example, the complex radio-halo morphology and spectral index distribution, high-frequency cut-off in the radio-halo spectrum, and spectral radial steepening, support primary model predictions. Nevertheless, Ensslin et al. (2011) showed that the radio-halo formation could also be explained by means of a high central energy density concentration of cosmic rays that is expected to be typical of clusters undergoing major mergers and that are strongly turbulent. We note that at the moment neither the primary nor the secondary models allow an exhaustive description of the observational properties of radio halos. It seems more likely that relativistic electrons continuously generated by hadronic collisions that occur in all galaxy clusters coexist with a population of relativistic electrons (re-) accelerated through magnetohydrodynamical turbulence caused by cluster mergers (see Cassano 2009, and references therein). The general picture has become even more complex because of the recent discovery of radio halos in low X-ray luminosity clusters (see Giovannini et al. 2011, and references therein), which poses new questions concerning the radio-halo formation processes. Detailed analyses of the radio-halo emission at different frequencies are essential to shed light on these aspects.
In this paper we study the spectral index of the radio halo in the galaxy cluster Abell 520 between 325 and 1400 MHz. In Sect. 2 a description of the current radio, X-ray, and optical knowledge on A520 is given. In Sect. 3 the radio observations and data reduction procedures are presented. In Sect. 4 the results about the spectral index of the radio halo and the radio galaxies in A520 are shown. In Sect. 6 we discuss the results, while in Sect. 7 we draw our conclusions.
Throughout this paper we adopted a ΛCDM cosmology with H0 = 71 km s-1 Mpc-1, Ωm = 0.27, and ΩΛ = 0.73. At the distance of A520 (z = 0.199, Struble & Rood 1999), 1′′ corresponds to 3.25 kpc.
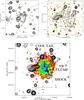 |
Fig. 1 Top left panel: total intensity radio contours at 1400 MHz (VLA in D configuration) with an FWHM of 50′′ × 50′′. The contour levels are − 0.15 mJy/beam, 0.15 mJy/beam, and the rest are spaced by a factor 2. Top right panel: total intensity radio contours at 1400 MHz (VLA data in C configuration) with an FWHM of 16′′ × 16′′. The contour levels are − 75 μJy/beam, 75 μJy/beam, and the rest are spaced by a factor 2. The contours of the radio intensity are overlaid on the red plate of the Sloan Digital Sky Survey. Bottom panel: total intensity radio contours at 1400 MHz (combining VLA data in C and D configuration) with an FWHM of 26′′ × 26′′. The contour levels are − 90 μJy/beam, 90 μJy/beam, and the rest are spaced by a factor |

2. Galaxy cluster Abell 520
Abell 520 is a complex and interesting galaxy cluster that has been observed in the X-ray, optical, and radio domain. By analyzing NRAO Very Large Array (VLA) Sky Survey (NVSS, Condon et al. 1998) images, Giovannini et al. (1999) found for the first time hints of diffuse large-scale emission in this cluster, which was later confirmed by Govoni et al. (2001). Govoni et al. (2001) revealed a wide radio halo whose largest linear extent is 1.4 Mpc, elongated in the NE-SW direction, as the location of the central X-ray emission. Indeed, ROSAT low-resolution X-ray observations indicate that the X-ray emission consists of an inner elongation in the NE-SW direction and of an outer emission in the SE-NW direction. High-resolution Chandra X-ray observations by Govoni et al. (2004) indicated that this system is undergoing a strong merger event in the NE-SW direction. These authors detected a dense, cool gas clump to the southwest of the cluster, probably coming from northeast, that is followed by a cool tail characterized by a strip of hot gas in which the radio-halo emission appears to originate (see the bottom panel of Fig. 1).
Merger shocks have been firmly detected only in a few clusters from jumps in X-ray surface brightness and in temperature. Some examples are A3667 (Vikhlinin et al. 2001; Sarazin et al. 2013) and Coma (Neumann et al. 2001; Akamatsu et al. 2013; Ogrean & Brueggen 2013). Another example is A2146, where Russell et al. (2010) found a bow shock from a sharp discontinuity in the temperature and gas density. Deep Chandra observations reported by Markevitch et al. (2005) of A520 indicated the presence of a bow shock, which was previously suggested by Govoni et al. (2004), in front of the dense clump; this is coincident with the SW edge of the radio halo. This shock is characterized by a Mach number  and is the second unambiguously recognized supersonic merger shock front in a cluster that shows a sharp gas density edge and a clear temperature jump (the first one is the Bullet cluster, Markevitch et al. 2002). Markevitch et al. (2005) stated that the electrons responsible for the edge of the radio-halo emission in A520 may be accelerated by this shock and according to this hypothesis, they expect a slope of the radio-halo spectrum α ≃ 1.2 corresponding to the edge. The spectrum probably quickly steepens as a function of the distance from the edge in the post-shocked region, since no turbulence or another kind of acceleration mechanism are supposed to be present in between the shock and the cool tail in the NE. This trend has been observed in elongated relics, for example in A1240 (Bonafede et al. 2009b) and in CIZAJ2242.8+5301 (van Weeren et al. 2010), where the spectral index steepens toward the cluster center. On the other hand, if the efficiency of the shock is not enough to accelerate the electrons, the radio edge may be caused by the compression of the magnetic field. In this scenario, Markevitch and collaborators expect to detect a 10–20 times fainter radio emission with the same spectrum in front of the shock, where the pre-compressed relativistic particles and magnetic fields exist.
Optical investigations by Proust et al. (2000) also indicated a complex system where the main concentration of galaxies is characterized by two extensions. These authors suggested that this cluster is a dynamically young system and that the extensions are related to clumps of galaxies that collide on a dark-matter gravitational well that is located at the center of the X-ray emission region. This insight has been confirmed by the analysis of Jee et al. (2012). By means of high-resolution weak-lensing studies carried out with Hubble Space Telescope data, they mapped a filamentary structure 1.5 Mpc in size elongated in the NE-SW direction and confirmed the dark-matter core with a significance higher than 10σ. This core has previously been observed by Mahdavi et al. (2007) at a 4σ level. In contrast with observations in other merging galaxy clusters (e.g., the Bullet cluster, Clowe et al. 2006) and with the collisionless dark-matter scenario, the dark-matter core is at the same location as the X-ray luminosity distribution peak, but in a location different from that of the bright cluster galaxies. Results from Girardi et al. (2008) from TNG and INT observations combined with data from the literature and from the CNOC team (Carlberg et al. 1996; Yee et al. 1996) suggest that the cluster formation is taking place at the crossing of three filaments: one in the NE-SW direction, one in the EW direction, and one almost aligned with the line of sight. The peak in the dark matter distribution may therefore be the consequence of projection effects.
By analyzing new Hubble Space Telescope data, Clowe et al. (2012) did not detect the dark-matter core and, after subtracting the X-ray plasma mass, they found a good agreement between the mass distribution in this cluster and the luminosity distribution of the cluster galaxies, and between weak-lensing mass measurements and the morphology of the core-galaxy-filled structure. Moreover, they found that the mass within a sphere encompassing a mean overdensity of 200 is M200 = (9.1 ± 1.9) × 1014M⊙, in agreement with previous works.
3. Radio observations and data reduction
We present archival observations (projects AC0776 and AC0706) of A520 at 325 and 1400 MHz obtained using the Very Large Array (VLA) in spectral line and continuum mode, respectively. The observations at 325 MHz were obtained in B and C configurations, while those at 1400 MHz were made in C and D configurations. The details of the observations are summarized in Table 1. The data reduction was performed following standard procedures using the NRAO Astronomical Image Processing System (AIPS) package. Total intensity images were produced with the multi-scale clean technique (see e.g. Greisen et al. 2009), an extension of the classical clean algorithm implemented in the task IMAGR. The fluxes are expressed according to the Perley–Taylor 1999.2 scale 2.
At 1400 MHz the radio source 0542 + 498 = 3C 147 was used as primary flux-density calibrator, while the nearby source 0503 + 020 was used as complex gain calibrator. Radio interferences were carefully excised. The two IFs were averaged to obtain the surface brightness image, and several cycles of self-calibration and CLEAN were applied.
The 325 MHz data were obtained with a total bandwidth of 6.25 MHz, subdivided into 16 channels with a resolution of 390 kHz each. We excluded the edge channels and averaged over channels, resulting in five channels with a resolution of ~1 MHz each. The radio source 0542 + 498 = 3C 147 was used as primary flux-density and bandpass calibrator, while the nearby source 0521 + 166 = 3C 138 was used as complex gain calibrator. Radio interferences were carefully excised with a flag of about 30% of the data. To obtain the surface brightness image we averaged the five channels of the two IFs together in the gridding process using IMAGR. Since VLA images over a wide field of view suffer from distortions because of the noncoplanarity of the array (Perley 1999), we covered the central ~4° with several small overlapping facets. Strong sources outside this area can affect the final image because their secondary lobes can be present in our field of view at this frequency. To include these sources in the cleaning process, we searched for sources with a flux higher than 0.5 Jy at 1400 MHz in a region of about ~6° in radius, using the NVSS catalog. These sources were included in the cycles of self-calibration and CLEAN, applied to remove residual phase variations. After self-calibration, discrete sources at a linear distance larger than ~1.5 Mpc were subtracted to better image the diffuse emission at the center of the cluster.
Information on total intensity images.
Moreover, for each frequency, data corresponding to different configurations of the VLA were combined aiming at producing images with better uv-coverage and sensitivity but still good angular resolution. The sensitivities of the final images are summarized in Table 2. We note that our sensitivity at 325 MHz in C configuration ~0.8 mJy/beam is slightly higher than the theoretical noise for the bandwidth and the duration of the observations (~0.5 mJy/beam, on the same order as the confusion limit at this frequency ~0.44 mJy/beam), while at 1400 MHz our sensitivity in D configuration ~50 μJy/beam is limited by the confusion.
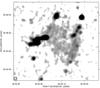 |
Fig. 2 Total intensity radio brightness at 1400 MHz (VLA data in C configuration) with an FWHM of 16′′ × 16′′. |
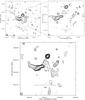 |
Fig. 3 Top left panel: total intensity radio contours at 325 MHz (VLA in C configuration) with an FWHM of 60′′ × 60′′. The contour levels are − 2.4 mJy/beam, 2.4 mJy/beam and the rest are spaced by a factor 2. Top right panel: total intensity radio contours at 325 MHz (VLA data in B configuration) with an FWHM of 18′′ × 18′′. The contour levels are − 1.8 mJy/beam, 1.8 mJy/beam and the rest are spaced by a factor 2. Bottom panel: total intensity radio contours at 325 MHz (combining VLA data in B and C configuration) with an FWHM of 26′′ × 26′′. The contour levels are − 2.1 mJy/beam, 2.1 mJy/beam and the rest are spaced by a factor |
The 1400 MHz total intensity images of the radio emission in A520 at different resolutions are shown in Fig. 1. The top left panel shows the image in D configuration, where the full extent of the radio halo is visible. After correcting for the primary beam and masking the radio galaxies, we measure a flux of the radio halo at 1400 MHz S1400 MHz = (16.7 ± 0.6) mJy from this image. Here and in the following, the total error is the quadratic sum of the statistical error and of the systematic error. The statistical error includes calibration, while the systematic error is related to the flux-scale uncertainty, which we assumed to be 3% of the measured flux to take into account the bootstrap uncertainty as well. We note that this value of the flux differs from the 34 mJy measured by Govoni et al. (2001) probably because of differences in subtracting the point sources. From now on the value of (16.7 ± 0.6) mJy should be considered as the reference. Subtracting the flux of discrete sources measured with C configuration data from the total flux over the region covered by the diffuse emission measured with D configuration gives an estimate consistent with this value within the errors. A higher-resolution image obtained from the data in C configuration is shown in the top right panel, but see also Fig. 2 for a grayscale visualization. The radio contours are superposed on an optical image from the Sloan Digital Sky Survey red plate. Radio galaxies at the boundary of the diffuse emission can be easily identified. Some of them present an optical counterpart, that is, source A and the two narrow-angle-tail sources D and E. In the bottom panel a combination of the datasets in D and in C configuration is shown. The radio isocontours are overlaid on an ACIS-I Chandra X-ray image in the 0.8–4 keV band (Govoni et al. 2004). The cluster is characterized by substructures on scales ≳80 kpc both at the radio and X-ray wavelengths. In the cluster center as well as in the outskirts, where the bow shock is detected, peaks and substructures in the X-ray and in the radio image have the same spatial location, indicating a deep link between thermal and nonthermal properties in this system.
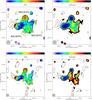 |
Fig. 4 Radio contours at 325 MHz overlaid on the spectral index image (left panels) and on the spectral index error image (right panels) of A520 between 325 and 1400 MHz with a resolution of 60′′ × 60′′ (top panels) and 39′′ × 39′′ (bottom panels). We blanked pixels with brightness below 3σ at 325 or 1400 MHz. The crosses in the low-resolution image represent the radio galaxies embedded in the diffuse emission. |
The total intensity images of the galaxy cluster at 325 MHz are shown in Fig. 3. The low-resolution image is presented in the top left panel. The radio halo is extended in the same way as in the low-resolution image at 1400 MHz (top left panel in Fig. 1), while the emission of some discrete sources observed at 1400 MHz is below the noise level in this image, giving an upper limit for their spectral index (see Sect. 4.2). After correcting for the primary beam and masking radio galaxies, we measure a flux density for the radio halo of S325 MHz = (85 ± 5) mJy from this image. A high-resolution image at 325 MHz is shown in the top right panel, where the radio-halo emission is completely resolved. The combination of the B and C configuration observations is shown in the bottom panel.
The integrated spectral index evaluated from the above fluxes is  . The spectral index of discrete radio sources is presented in Sect. 4.2.
4. Spectral index images
To produce spectral index images of the radio emission at the center of the cluster we compared total intensity images at 325 and 1400 MHz using images produced with the same uv-coverage, resolution, and pixel size, and the Dan Briggs AIPS robustness parameter set to zero. As discussed in Orrù et al. (2007), considering only pixels with a signal higher than 3σ at both frequencies implies a bias in the measurement of the spectral index, since regions with a flat spectrum cannot be investigated. The faintest regions of the radio halo at 1400 MHz are above the noise at 325 MHz only if the radio-halo spectral index is steeper than ~2. To minimize this effect, we directly compared the total intensity images at 325 and 1400 MHz in the analysis of the radial profile of the spectral index without applying a cut in brightness, unless otherwise specified.
4.1. Radio halo
In Fig. 4 the image of the spectral index of the radio halo and the radio galaxies embedded in the diffuse emission and the image of the 1σ uncertainty evaluated pixel by pixel are shown at 60′′ (~200 kpc), top panels, and at 39′′ (~120 kpc), bottom panels.
The low-resolution image allows a better recovery of the faint structures in the North and the Southeast, where flatter spectral index values can be observed. We evaluated the spectral index in the regions indicated in Fig. 4 (top left panel) by using boxes 1.5 times the beam in size. The north (REGION1 in Fig. 4) shows an average spectral index of ⟨α⟩ = 1.03, the southwest (REGION2) of ⟨α⟩ = 1.22 and the southeast (REGION3) of ⟨α⟩ = 1.23. These values are consistent with those evaluated directly from the integrated fluxes at the two frequencies.
In Fig. 5 the azimuthally averaged brightness profile at 325 and 1400 MHz (top panel) and the consequent spectral index (bottom panel) are shown. Since we are interested in the average radial behavior of the spectral index, we measured the surface brightness from the 60′′ resolution images. Each data point with its 1σ uncertainty represents the average brightness in concentric annuli of half-beam-width centered on the X-ray peak3, as shown in the inset. The arrows represent the upper limits at 3σ. Discrete sources have been masked out and were excluded from the statistics. Their flux and spectral index are given in Sect. 4.2. The spectral index profile of the radio halo appears to be very flat.
In Fig. 6 the radio brightness at 325 and 1400 MHz (top panel) and the consequent spectral index (bottom panel) along a sector of the diffuse emission are shown. Each data point with its 1σ uncertainty represents the average brightness in a sector of concentric annuli of beam-width centered on the shock peak and crossing the direction of propagation of the shock and the NE periphery along the cool tail, see the inset panel. To be more sensitive to small-scale variations we used the total intensity images at 39′′. The brightness of the radio halo remains flat both at 325 and at 1400 MHz, with a consequent flat spectral index.
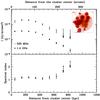 |
Fig. 5 Top: azimuthally averaged brightness of the radio halo at 325 (triangles) and 1400 MHz (circles) versus the distance from the cluster center at a resolution of 60′′. Arrows represent 3σ upper limits. In the inset we show the annuli used to calculate the azimuthally averaged brightness. Masks have been used to exclude discrete sources from the statistics. Bottom: spectral index radial profile. |
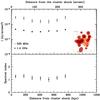 |
Fig. 6 Top: azimuthally averaged brightness of the radio halo at 325 (triangles) and 1400 MHz (circles) in a sector of concentric annuli versus the distance from the shock peak at a resolution of 39′′. The sector starts in the southwest and crosses the cluster towards the northeast, see the inset. Bottom: spectral index along the sector. |
4.1.1. Fluctuations in the radio-halo spectral index image
In Table 3 the statistics of the spectral index and the spectral index error images of the radio halo at 39′′ and 60′′ (Fig. 4) are summarized. The mean values of the spectral index and of its error agree well at the two resolutions.
Statistics of the spectral index and the spectral index error images.
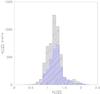 |
Fig. 7 Histogram of the spectral index values from the image at 60′′ (black) and 39′′ (blue) resolution. These distributions have a mean value and a dispersion ⟨α60′′⟩ = 1.21 and σα60′′ = 0.23 at 60′′ and ⟨α39′′⟩ = 1.25 and σα39′′ = 0.22 at 39′′. |
The spectral index image of the radio halo looks clumpy, with fluctuations both at high and at low resolution. To investigate the nature of these fluctuations we studied the distribution of the spectral index values. We extracted the information pixel by pixel from the spectral index and the spectral index error image after masking the radio galaxies (Fig. 7) and calculated the mean and the sigma over these values. The blue histogram refers to the 39′′ image, the black one to the 60′′ image. The two distributions have a mean value ⟨α60′′⟩ = 1.21 and dispersion σα60′′ = 0.23 at 60′′, and ⟨α39′′⟩ = 1.25 and σα39′′ = 0.22 at 39′′. The distributions are asymmetric with respect to the mean value at high- and low-resolution. Indeed, they miss the flatter spectral index values, because of the cut in total intensity applied to produce the two spectral index images.
The error image of the spectral index was produced by evaluating the uncertainty on a pixel basis, therefore, if the patchy structure of the spectral index image is due to measurement errors, we expect that the mean value of the error image and the dispersion of the spectral index distribution are similar. When compared with the mean value of the spectral index error image, the dispersion of the distributions in Fig. 7 is slightly higher at high- and low-resolution.
We conclude that the measurement errors significantly contribute to the observed fluctuations in the spectral index distribution. Moreover, the spatial frequency coverage may cause instrumental noise that is responsible for fluctuations on spatial scales of about the resolution size. Nevertheless, a certain degree of intrinsic complexity seems to be present.
4.1.2. Radio-halo spectral index and X-ray properties of the cluster
A520 is one of the first clusters for which a comparison between the shape of the radio and X-ray brightness profile has been performed, see Govoni et al. (2001). These authors found that the two azimuthally averaged profiles do not show a close similarity as instead observed in other clusters (e.g. Coma, A2255, A2319); the radio halo is elongated, the X-ray emission is quite extended and symmetric.
To infer some information about a possible link between the radio-halo emission and the thermal properties of the hosting cluster we compared the spectral index with the X-ray brightness and the thermal-gas temperature images. In Fig. 8, we show the radio-halo spectral index image at 39′′ superimposed with the contours from the Chandra X-ray brightness image in the 0.8–4 keV band. The bright region coincident with the shock detected in the X-ray image is characterized by an average spectral index ~1.25 that flattens to values ~1–1.1 behind (in the Northeast) and in front (in the South) of the shock.
A point-to-point correlation between the radio-halo spectral index and the thermal-gas temperature has been observed for the first time in the cluster A2744 (Orrù et al. 2007), indicating that regions of the radio halo with a flat spectrum are characterized by higher temperatures. We searched for this correlation for the radio halo in A520. To be more sensitive to point-to-point fluctuations in the spectral index, we used the image at 39′′. For the temperature we used the image from Govoni et al. (2004). In Fig. 9 the exponential smoothing of the spectral index between 325 and 1400 MHz versus thermal-gas temperature is shown. The data were extracted pixel by pixel and were then exponentially smoothed, that is, a weighted moving average with exponential weights was performed, with a smoothing scale of 1 keV. Discrete sources were masked out and were excluded from the statistics. The shaded region describes the 1σ uncertainty. In the coldest regions (~2 keV), the spectral index is between 1.1 and 1.4. Moving to higher temperatures, for instance, in the South and in the Northeast of the cluster, the spectral index decreases to ~0.9 with a scatter of ~0.05.
If a general temperature of the thermal gas in A520T = (7.1 ± 0.7) keV is considered according to Govoni et al. (2004), the values of spectral index and temperature observed in A520 follow the trend found for the other radio halos by Giovannini et al. (2009) and Feretti et al. (2012).
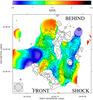 |
Fig. 8 X-ray contours from the 0.8–4 keV X-ray image overlaid on the spectral index image of the radio halo at 39′′. The contours are spaced by a factor of |
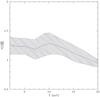 |
Fig. 9 Exponential smooth of the spectral index α between 325 and 1400 MHz versus thermal-gas temperature T. We adopted a smoothing scale of 1 keV. |
Fluxes of radio galaxies.
4.2. Radio galaxies
A dominant radio galaxy cannot be identified at the center of the cluster, but several powerful sources are present in the outskirts of the diffuse radio-halo emission. These radio sources are labeled in Figs. 1 and 3 (top right panels) and their flux at 325 and 1400 MHz along with their integrated spectral index are given in Table 4. Only three of them have been found to have an optical counterpart, these are A, D, and E which have been identified as cluster members (see Cooray et al. 1998; and Girardi et al. 2008).
The sources D and E are narrow-angle tail radio galaxies of sizes ~300 and 500 kpc, located to the east of the cluster and oriented in the opposite direction with respect to the cluster center. Their spectra are quite similar: flatter close to the nucleus (α ~ 0.7) and steeper moving toward the external part of the tail, up to values 1.5 and higher.
Source A is a point-like source. According to the flux measured at 1400 MHz and the upper limit inferred from the 325 MHz image, we can conclude that it is characterized by an inverted spectrum.
Sources B and F show no optical counterpart. The radio source F is to the southeast of the cluster and its signal is below the noise level at 325 MHz, allowing only an upper limit on its spectral index. Source B has a double-lobed structure of size ~300 kpc assuming the redshift of A520, is located to the west of the cluster, and has a spectral index ranging across the source of between 0.7 and 1.4.
Source C is a powerful source in the north, only marginally resolved at a resolution of ~15′′. From Fig. 1 top right panel, two optical candidates slightly displaced from the peak of the radio source emission can be identified. This source is characterized by the steepest spectrum in the field. Between 325 and 1400 MHz its spectral index is α = 1.59 ± 0.03. We investigated its emission also at lower frequencies by using VLA Low-Frequency Sky Survey Redux (VLSSr, Lane et al. 2012). From the VLSSr image at 74 MHz we measured a flux S74 MHz = (870 ± 190) mJy. This flux is expressed according to the Scaife & Heald (2012) scale and was corrected for the clean bias. In Fig. 10 the spectrum of the source between 74 and 1400 MHz is shown. From the fit of the spectrum in this range of frequencies we infer an overall averaged spectral index α = 1.60 ± 0.03 in good agreement with the estimate obtained by using only higher-frequency data. New JVLA observations at higher resolution (Vacca et al., in prep.) reveal that the source is a double-lobed radio source, while its emission is below the noise level at 5000 MHz. The steep spectrum, the possible displacement between the radio and optical emission, and the double-lobed structure of this source suggest that it may be classified as a dying source (e.g. Parma et al. 2007; Murgia et al. 2011). Alternatively, this source may be the radio counterpart of an high-redshift typical cluster-member elliptical galaxy not detected in optical surveys because of sensitivity reasons.
5. Radio-halo brightness profile
According to Murgia et al. (2009), the azimuthally averaged brightness profile of radio halos can be modeled with an exponential law 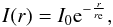 (1)where I0 and re are the central radio surface brightness and the e-folding radius. From the central brightness and the e-folding radius, the radio emissivity of the diffuse emission can be inferred. This model does not account for the local deviations from the circular symmetry of the diffuse emission, but gives a good description of the averaged properties, involving a minimum set of free parameters and allowing a comparison with other radio halos. Murgia et al. (2009) noted that it is a simplistic description and also considered more realistic pictures, for example the injection model. According to this, the radio-halo brightness profile would be
 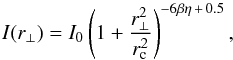 (2)where I(r⊥) is the brightness value at the r⊥ projected distance from the cluster center and I0 is the central radio-halo brightness. The diffuse emission is assumed to be generated by an isotropic population of relativistic electrons with a power-law energy spectrum and is in a steady-state of continuous injection. A radio-halo spectral index α = 1 is considered, corresponding to a perfect equipartition condition between particles and field (see Brunetti et al. 1997; Beck & Krause 2005). The magnetic field has been assumed to be completely tangled and an average over all the possible directions between the magnetic field and the line-of-sight has been performed. The magnetic-field strength is assumed to be radially decreasing as a function of the thermal-gas density, taken to follow a β-model (Cavaliere & Fusco-Femiano 1976).
By using the procedure implemented in the software FARADAY (Murgia et al. 2004), we aimed to fit the azimuthally averaged radial profile of the radio halo in A520 both considering an exponential and an injection model. For the injection model, we adopted the gas density parameters derived by Govoni et al. (2001) from ROSAT X-ray data that we re-scaled to our chosen cosmology (ne(0) = 3.8 × 10⁻³cm-3, rc = 127′′ = 413 kpc and β = 0.87). In both cases the fits do not allow a good description of the data points. Indeed, the radial profile remains flat up to distances from the cluster center of ~400 kpc, see Fig. 5. This peculiarity has previously been noticed by Govoni et al. (2001), who did not exclude that this emission might be a peripheral source seen in projection toward the cluster center.
6. Discussion
6.1. Radio-halo spectral index image
The spectral index image of the radio halo in A520 (Fig. 4) looks clumpy, with fluctuations both in the 39′′ and in the 60′′ resolution images. The distribution of the spectral index has a dispersion slightly higher than the mean value of the spectral index error image. This suggests that the measurement process significantly contributes to the observed fluctuations even if a certain degree of intrinsic clumpiness is present. According to primary models of radio-halo formation (e.g. Schlickeiser et al. 1987; Petrosian 2001; Brunetti & Lazarian 2007, 2011), magnetohydrodynamical turbulence caused by cluster mergers is assumed to stochastically (re-)accelerate preexisting electrons through Fermi-II processes, causing diffuse large-scale synchrotron-radio emission in massive galaxy clusters. In this scenario, a complex cluster distribution of the spectral index is expected. In contrast, secondary models of radio-halo formation (e.g. Dennison 1980; Pfrommer et al. 2008; Ensslin et al. 2011) propose that the diffuse large-scale synchrotron-radio emission is caused by a continuous generation of relativistic electrons through the collision between relativistic protons (accelerated during the cluster history) and thermal protons in the ICM. In this scenario, a uniform distribution of the radio-halo spectral index is expected.
The intrinsic complexity observed in the radio-halo spectral index image of A520 agrees with the predictions from primary models, although secondary models cannot be excluded. According to primary models, a radial steepening and a complex spatial distribution of the spectral index is expected because of a different (re-)acceleration efficiency in different cluster regions and/or variations in the local magnetic-field strength. Consequently, the radial steepening in the radio-halo spectral index distribution would suggest that the outer regions of the radio halo are characterized by inefficient acceleration processes and/or a radial gradient in the magnetic-field strength. Therefore, if interpreted in the context of a primary-model scenario, the flatness in the spectral index of the radio halo in A520 could indicate a fine-tuning between the magnetic-field strength and the power supply up to large (~1 Mpc) distances from the cluster center, in the radio-halo periphery.
6.2. Shock wave
Feretti et al. (2004) found that the spectral index in A665 steepens at increasing distances from the cluster center, along the direction of the shock propagation. The authors interpreted this behavior as due to the fact that shocks associated with major mergers are not strong enough to accelerate particles, as predicted by Gabici & Blasi (2003). The shocks in A665 and in A520 are characterized by the same Mach number (M ~ 2), therefore we expect in A520 a similar behavior as observed in A665. In contrast, according to the hypothesis that major merger shocks are efficient in accelerating radiating electrons, and since no turbulence or another kind of acceleration mechanism are assumed to be present in between the shock and the northeast clump, Markevitch et al. (2005) expected different spectral index for these two regions and a steepening of the spectral index along the shock in A520, starting from a value of α = 1.2 at the bow-shock location.
By considering a sector along the direction of the shock propagation and the cool tail in the NE, we measured a spectral index of ~1.2 that remains flat. Even if we measured a spectral index α =1.2 at the bow-shock location in agreement with the predictions from Markevitch et al. (2005), our analysis does not reveal the steepening of the spectral index in the direction of the shock propagation that they expect. The 1σ errors on the spectral index rule out spectral steepening from SW to NE at a confidence level of ~80%. Moreover, the significant spectral difference between the radio emission at the shock location and that in the NE that Markevitch et al. (2005) speculate is not present.
The behavior of the spectral index distribution in A520 differs from that observed in A665 and indicates that some efficient powering mechanism is at work even at large distances (~1 Mpc) from the cluster center. The spectral slope observed at the shock location in A520 does not exclude shock-accelerated electrons, while the flatness of the spectrum along the direction of the shock propagation and the absence of significant spectral differences between the SW and the NE of the diffuse emission might indicate turbulence in the intermediate region. An alternative possibility is that turbulence is powering the emitting particles up to distances of 1 Mpc from the cluster center.
Deep radio observations at higher resolution both at 1400 and at 325 MHz would allow one to measure the spectral index distribution directly behind the location of the shock with a high degree of accuracy, giving valuable information for distinguishing between the two scenarios. Moreover, sensitive X-ray observations would allow one to probe the possible presence of turbulence in the intermediate region and at ~Mpc distance from the cluster center (see e.g. Schuecker et al. 2004 for the Coma cluster).
6.3. Radio-halo spectral index versus thermal-gas temperature
To infer some information about a possible correlation between the radio and X-ray emission in the cluster, we compared the spectral index distribution with the thermal-gas temperature image.
A520 follows the trend of the integrated spectral index versus temperature observed for other clusters. A strong point-to-point correlation between the radio-halo spectral index and the thermal-gas temperature is absent in A520, see Fig. 9. A similar case has been observed in MACS J00717+3745 (Bonafede et al. 2009a). In that case the authors concluded that it is caused by projection effects. A correlation between the distribution of the radio-halo spectral index and the thermal-gas temperature has been observed in the galaxy cluster A2744 (Orrù et al. 2007). In the case of A520, the absence of this correlation may be due to the peculiarity of the diffuse emission and to the fact that it might be a source at the cluster periphery seen in projection, as Govoni et al. (2001) noted, see the discussion in Sect. 6.4.
6.4. Radio-halo nature
The diffuse synchrotron emission in A520 has originally been classified as a cluster radio halo because of its location (Giovannini et al. 1999). The high-resolution images of the radio halo at 1400 MHz (Fig. 1, top right and bottom panels) show that the brighter structures of the diffuse emission are located to the northeast of the cluster, at the same spatial location as the cool tail, and to the southwest of the cluster, aligned with the shock. In between, a depression in the radio surface brightness can be observed. The mass distribution (Clowe et al. 2012) and the diffuse radio emission are clearly linked. Indeed, we note that the nonthermal emission permeates regions of high mass. The NE clump is aligned with the elongated mass distribution (NE to SW): structures 2+3 in Fig. 2 by Clowe et al. (2012). The diffuse emission at the shock location in the SW is observed to correspond with the 4–7 structures in the same figure.
In contrast with most of the radio halos observed to date, the azimuthally averaged brightness profile cannot be modeled either with an exponential law or with a more realistic model based on the continuous injection of relativistic electrons (Murgia et al. 2009). Indeed, the brightness remains flat up to distances ~400 kpc from the cluster center. This flatness has previously been noted by Govoni et al. (2001), who did not exclude that this is a source at the cluster periphery, apparently located at the cluster center because of projection effects. Another possible explanation is that we are looking at a relic in the SW and a young still-forming radio halo in the NE. In the past the cluster may have been crossed by several shocks, one of which now powers the diffuse nonthermal emission in the SW. Along the tail of the shock, turbulence caused by the merger is allowing the formation of a radio halo. This would explain the absence of a central peak in the radio emission. A similar emission has been observed in the cluster 1RXS J0603.3+4214 (van Weeren et al. 2012).
Typically, elongated relics are characterized by a filamentary structure, which has not been observed in this case with the available data, however sensitive high-resolution observations are necessary to rule out the presence of filamentary substructures. The spectral index of the emission at the SW edge does not show an obvious distribution. Elongated relics show a clear spectral steepening toward the cluster center, while a specific trend has not been detected in roundish relics (see Feretti et al. 2012). Currently, we have no information about polarization properties of the source. The degree of polarization of the emission could be very useful in testing the relic scenario. An analysis of the polarimetric properties is currently in progress (Vacca et al., in prep.).
7. Conclusions
We presented the spectral index image of the radio halo at center of the cluster A520, obtained by comparing VLA observations at 1400 and 325 MHz. We found an integrated spectral slope 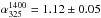 .
.
The clumpy morphology in the radio-halo spectral index image supports the primary models of radio-halo formation. In this framework, the flatness of the spectrum suggests an ongoing-merger phenomenon that uniformly and continuously (re-) accelerates relativistic electrons in situ up to the distance where the shock wave has been detected.
The integrated spectral index and the general thermal gas temperature agree well with the trend observed in other galaxy clusters, although we did not observe a clear point-to-point correlation between the spectral index and the thermal-gas temperature. The lack of this correlation can be explained in the context of the peculiar nature of the radio emission at the center of the cluster. This emission has originally been classified as a radio halo, but the brightness profile of this source strongly differs form those observed in other radio halos. New deep polarimetric observations across a wide frequency range are necessary to better understand the nature of the diffuse emission in A520 and to investigate the connection between the thermal and nonthermal properties of this galaxy cluster.
Throughout this work we adopt the convention S(ν) ∝ ν− α.
See the VLA Calibrator Manual, http://www.vla.nrao.edu/astro/calib/manual/baars.html.
As X-ray peak we adopted the value give by Govoni et al. (2001), RA (J2000) = 04h54m10.6s and Dec (J2000) = + 02°55′20′′.
Acknowledgments
We thank the referee for helpful comments and suggestions that improved the paper. The research was partially supported by PRININAF2009. The National Radio Astronomy Observatory (NRAO) is a facility of the National Science Foundation, operated under cooperative agreement by Associated Universities, Inc. Basic research in radio astronomy at the Naval Research Laboratory is supported by 6.1 Base funding.
References
- Akamatsu, H., Inoue, S., Sato, T., et al. 2013, PASJ, 65, 89 [NASA ADS] [Google Scholar]
- Bacchi, M., Feretti, L., Giovannini, G., & Govoni, F. 2003, A&A, 400, 465 [NASA ADS] [CrossRef] [EDP Sciences] [Google Scholar]
- Beck, R., & Krause, M. 2005, Astron. Nachr., 326, 414 [NASA ADS] [CrossRef] [Google Scholar]
- Bonafede, A., Feretti, L., Giovannini, G., et al. 2009a, A&A, 503, 707 [NASA ADS] [CrossRef] [EDP Sciences] [Google Scholar]
- Bonafede, A., Giovannini, G., Feretti, L., Govoni, F., & Murgia, M. 2009b, A&A, 494, 429 [NASA ADS] [CrossRef] [EDP Sciences] [Google Scholar]
- Brentjens, M. A. 2008, A&A, 489, 69 [NASA ADS] [CrossRef] [EDP Sciences] [Google Scholar]
- Brunetti, G., & Lazarian, A. 2007, MNRAS, 378, 245 [NASA ADS] [CrossRef] [Google Scholar]
- Brunetti, G., & Lazarian, A. 2011, MNRAS, 410, 127 [NASA ADS] [CrossRef] [Google Scholar]
- Brunetti, G., Setti, G., & Comastri, A. 1997, A&A, 325, 898 [NASA ADS] [Google Scholar]
- Brunetti, G., Cassano, R., Dolag, K., & Setti, G. 2009, A&A, 507, 661 [NASA ADS] [CrossRef] [EDP Sciences] [Google Scholar]
- Brunetti, G., Rudnick, L., Cassano, R., et al. 2013, A&A, 558, A52 [NASA ADS] [CrossRef] [EDP Sciences] [Google Scholar]
- Carlberg, R. G., Yee, H. K. C., Ellingson, E., et al. 1996, ApJ, 462, 32 [Google Scholar]
- Cassano, R. 2009, The Low-Frequency Radio Universe, eds. D. J. Saikia, D. A. Green, Y. Gupta, & T. Venturi. ASP Conf. Ser., 407, 223 [Google Scholar]
- Cavaliere, A., & Fusco-Femiano, R. 1976, A&A, 49, 137 [NASA ADS] [Google Scholar]
- Clowe, D., Bradač, M., Gonzalez, A. H., et al. 2006, ApJ, 648, L109 [NASA ADS] [CrossRef] [Google Scholar]
- Clowe, D., Markevitch, M., Bradač, M., et al. 2012, ApJ, 758, 128 [NASA ADS] [CrossRef] [Google Scholar]
- Condon, J. J., Cotton, W. D., Greisen, E. W., et al. 1998, AJ, 115, 1693 [NASA ADS] [CrossRef] [Google Scholar]
- Cooray, A. R., Grego, L., Holzapfel, W. L., Joy, M., & Carlstrom, J. E. 1998, AJ, 115, 1388 [Google Scholar]
- Dennison, B. 1980, ApJ, 239, L93 [NASA ADS] [CrossRef] [Google Scholar]
- Ensslin, T. A. 2002, A&A, 396, L17 [NASA ADS] [CrossRef] [EDP Sciences] [Google Scholar]
- Ensslin, T., Pfrommer, C., Miniati, F., & Subramanian, K. 2011, A&A, 527, A99 [NASA ADS] [CrossRef] [EDP Sciences] [Google Scholar]
- Feretti, L., Giovannini, G., & Bohringer, H. 1997, New A, 2, 501 [Google Scholar]
- Feretti, L., Orrù, E., Brunetti, G., et al. 2004, A&A, 423, 111 [NASA ADS] [CrossRef] [EDP Sciences] [Google Scholar]
- Feretti, L., Giovannini, G., Govoni, F., & Murgia, M. 2012, A&ARv, 20, 54 [Google Scholar]
- Gabici, S., & Blasi, P. 2003, ApJ, 583, 695 [NASA ADS] [CrossRef] [Google Scholar]
- Giacintucci, S., Venturi, T., Brunetti, G., et al. 2005, A&A, 440, 867 [NASA ADS] [CrossRef] [EDP Sciences] [Google Scholar]
- Giovannini, G., Feretti, L., Venturi, T., Kim, K.-T., & Kronberg, P. P. 1993, ApJ, 406, 399 [NASA ADS] [CrossRef] [Google Scholar]
- Giovannini, G., Tordi, M., & Feretti, L. 1999, New A, 4, 141 [Google Scholar]
- Giovannini, G., Bonafede, A., Feretti, L., et al. 2009, A&A, 507, 1257 [NASA ADS] [CrossRef] [EDP Sciences] [Google Scholar]
- Giovannini, G., Feretti, L., Girardi, M., et al. 2011, A&A, 530, L5 [NASA ADS] [CrossRef] [EDP Sciences] [Google Scholar]
- Girardi, M., Barrena, R., Boschin, W., & Ellingson, E. 2008, A&A, 491, 379 [NASA ADS] [CrossRef] [EDP Sciences] [Google Scholar]
- Govoni, F., Feretti, L., Giovannini, G., et al. 2001, A&A, 376, 803 [NASA ADS] [CrossRef] [EDP Sciences] [Google Scholar]
- Govoni, F., Markevitch, M., Vikhlinin, A., et al. 2004, ApJ, 605, 695 [NASA ADS] [CrossRef] [Google Scholar]
- Greisen, E. W., Spekkens, K., & van Moorsel, G. A. 2009, AJ, 137, 4718 [NASA ADS] [CrossRef] [Google Scholar]
- Jee, M. J., Mahdavi, A., Hoekstra, H., et al. 2012, ApJ, 747, 96 [NASA ADS] [CrossRef] [Google Scholar]
- Kale, R., & Dwarakanath, K. S. 2010, ApJ, 718, 939 [NASA ADS] [CrossRef] [Google Scholar]
- Lane, W. M., Cotton, W. D., Helmboldt, J. F., & Kassim, N. E. 2012, Radio Sci., 47, RS0K04 [Google Scholar]
- Mahdavi, A., Hoekstra, H., Babul, A., Balam, D. D., & Capak, P. L. 2007, ApJ, 668, 806 [NASA ADS] [CrossRef] [Google Scholar]
- Markevitch, M., Gonzalez, A. H., David, L., et al. 2002, ApJ, 567, L27 [NASA ADS] [CrossRef] [Google Scholar]
- Markevitch, M., Govoni, F., Brunetti, G., & Jerius, D. 2005, ApJ, 627, 733 [NASA ADS] [CrossRef] [Google Scholar]
- Murgia, M., Govoni, F., Feretti, L., et al. 2004, A&A, 424, 429 [NASA ADS] [CrossRef] [EDP Sciences] [Google Scholar]
- Murgia, M., Govoni, F., Markevitch, M., et al. 2009, A&A, 499, 679 [NASA ADS] [CrossRef] [EDP Sciences] [Google Scholar]
- Murgia, M., Parma, P., Mack, K.-H., et al. 2011, A&A, 526, A148 [NASA ADS] [CrossRef] [EDP Sciences] [Google Scholar]
- Neumann, D. M., Arnaud, M., Gastaud, R., et al. 2001, A&A, 365, L74 [NASA ADS] [CrossRef] [EDP Sciences] [Google Scholar]
- Ogrean, G. A., & Brüggen, M. 2013, MNRAS, 433, 1701 [NASA ADS] [CrossRef] [Google Scholar]
- Orrú, E., Murgia, M., Feretti, L., et al. 2007, A&A, 467, 943 [NASA ADS] [CrossRef] [EDP Sciences] [Google Scholar]
- Parma, P., Murgia, M., de Ruiter, H. R., et al. 2007, A&A, 470, 875 [NASA ADS] [CrossRef] [EDP Sciences] [Google Scholar]
- Perley, R. A. 1999, Synthesis Imaging in Radio Astronomy II, eds. G. B. Taylor, C. L. Carilli, & R. A. Perley. ASP Conf. Ser., 180, 383 [Google Scholar]
- Petrosian, V. 2001, ApJ, 557, 560 [NASA ADS] [CrossRef] [Google Scholar]
- Pfrommer, C., & Enßlin, T. A. 2004, MNRAS, 352, 76 [NASA ADS] [CrossRef] [Google Scholar]
- Pfrommer, C., Ensslin, T. A., & Springel, V. 2008, MNRAS, 385, 1211 [NASA ADS] [CrossRef] [Google Scholar]
- Pizzo, R. F., & de Bruyn, A. G. 2009, A&A, 507, 639 [NASA ADS] [CrossRef] [EDP Sciences] [Google Scholar]
- Proust, D., Cuevas, H., Capelato, H. V., et al. 2000, A&A, 355, 443 [NASA ADS] [Google Scholar]
- Russell, H. R., Sanders, J. S., Fabian, A. C., et al. 2010, MNRAS, 406, 1721 [NASA ADS] [Google Scholar]
- Sarazin, C. L. 2002, Merging Processes in Galaxy Clusters, eds. L. Feretti, I. M. Gioia, & G. Giovannini, Astrophys. Space Sci. Lib., 272, 1 [Google Scholar]
- Sarazin, C. L., Finoguenov, A., & Wik, D. R. 2013, Astron. Nachr., 334, 346 [NASA ADS] [Google Scholar]
- Scaife, A. M. M., & Heald, G. H. 2012, MNRAS, 423, L30 [NASA ADS] [CrossRef] [Google Scholar]
- Schlickeiser, R., Sievers, A., & Thiemann, H. 1987, A&A, 182, 21 [NASA ADS] [Google Scholar]
- Schuecker, P., Finoguenov, A., Miniati, F., Böhringer, H., & Briel, U. G. 2004, A&A, 426, 387 [NASA ADS] [CrossRef] [EDP Sciences] [Google Scholar]
- Struble, M. F., & Rood, H. J. 1999, ApJS, 125, 35 [NASA ADS] [CrossRef] [Google Scholar]
- Thierbach, M., Klein, U., & Wielebinski, R. 2003, A&A, 397, 53 [NASA ADS] [CrossRef] [EDP Sciences] [Google Scholar]
- Vacca, V., Murgia, M., Govoni, F., et al. 2010, A&A, 514, A71 [NASA ADS] [CrossRef] [EDP Sciences] [Google Scholar]
- van Weeren, R. J., Intema, H. T., Oonk, J. B. R., Röttgering, H. J. A., & Clarke, T. E. 2009, A&A, 508, 1269 [NASA ADS] [CrossRef] [EDP Sciences] [Google Scholar]
- van Weeren, R. J., Roettgering, H. J. A., Brueggen, M., & Hoeft, M. 2010, Science, 330, 347 [NASA ADS] [CrossRef] [PubMed] [Google Scholar]
- van Weeren, R. J., Brüggen, M., Röttgering, H. J. A., et al. 2011, A&A, 533, A35 [NASA ADS] [CrossRef] [EDP Sciences] [Google Scholar]
- van Weeren, R. J., Röttgering, H. J. A., Intema, H. T., et al. 2012, A&A, 546, A124 [NASA ADS] [CrossRef] [EDP Sciences] [Google Scholar]
- Venturi, T., Giacintucci, S., Dallacasa, D., et al. 2013, A&A, 551, A24 [NASA ADS] [CrossRef] [EDP Sciences] [Google Scholar]
- Vikhlinin, A., Markevitch, M., & Murray, S. S. 2001, ApJ, 551, 160 [NASA ADS] [CrossRef] [Google Scholar]
- Yee, H. K. C., Ellingson, E., & Carlberg, R. G. 1996, ApJS, 102, 269 [NASA ADS] [CrossRef] [Google Scholar]
All Tables
All Figures
|
Fig. 1 Top left panel: total intensity radio contours at 1400 MHz (VLA in D configuration) with an FWHM of 50′′ × 50′′. The contour levels are − 0.15 mJy/beam, 0.15 mJy/beam, and the rest are spaced by a factor 2. Top right panel: total intensity radio contours at 1400 MHz (VLA data in C configuration) with an FWHM of 16′′ × 16′′. The contour levels are − 75 μJy/beam, 75 μJy/beam, and the rest are spaced by a factor 2. The contours of the radio intensity are overlaid on the red plate of the Sloan Digital Sky Survey. Bottom panel: total intensity radio contours at 1400 MHz (combining VLA data in C and D configuration) with an FWHM of 26′′ × 26′′. The contour levels are − 90 μJy/beam, 90 μJy/beam, and the rest are spaced by a factor |
| In the text | |
|
Fig. 2 Total intensity radio brightness at 1400 MHz (VLA data in C configuration) with an FWHM of 16′′ × 16′′. |
| In the text | |
|
Fig. 3 Top left panel: total intensity radio contours at 325 MHz (VLA in C configuration) with an FWHM of 60′′ × 60′′. The contour levels are − 2.4 mJy/beam, 2.4 mJy/beam and the rest are spaced by a factor 2. Top right panel: total intensity radio contours at 325 MHz (VLA data in B configuration) with an FWHM of 18′′ × 18′′. The contour levels are − 1.8 mJy/beam, 1.8 mJy/beam and the rest are spaced by a factor 2. Bottom panel: total intensity radio contours at 325 MHz (combining VLA data in B and C configuration) with an FWHM of 26′′ × 26′′. The contour levels are − 2.1 mJy/beam, 2.1 mJy/beam and the rest are spaced by a factor |
| In the text | |
|
Fig. 4 Radio contours at 325 MHz overlaid on the spectral index image (left panels) and on the spectral index error image (right panels) of A520 between 325 and 1400 MHz with a resolution of 60′′ × 60′′ (top panels) and 39′′ × 39′′ (bottom panels). We blanked pixels with brightness below 3σ at 325 or 1400 MHz. The crosses in the low-resolution image represent the radio galaxies embedded in the diffuse emission. |
| In the text | |
|
Fig. 5 Top: azimuthally averaged brightness of the radio halo at 325 (triangles) and 1400 MHz (circles) versus the distance from the cluster center at a resolution of 60′′. Arrows represent 3σ upper limits. In the inset we show the annuli used to calculate the azimuthally averaged brightness. Masks have been used to exclude discrete sources from the statistics. Bottom: spectral index radial profile. |
| In the text | |
|
Fig. 6 Top: azimuthally averaged brightness of the radio halo at 325 (triangles) and 1400 MHz (circles) in a sector of concentric annuli versus the distance from the shock peak at a resolution of 39′′. The sector starts in the southwest and crosses the cluster towards the northeast, see the inset. Bottom: spectral index along the sector. |
| In the text | |
|
Fig. 7 Histogram of the spectral index values from the image at 60′′ (black) and 39′′ (blue) resolution. These distributions have a mean value and a dispersion ⟨α60′′⟩ = 1.21 and σα60′′ = 0.23 at 60′′ and ⟨α39′′⟩ = 1.25 and σα39′′ = 0.22 at 39′′. |
| In the text | |
|
Fig. 8 X-ray contours from the 0.8–4 keV X-ray image overlaid on the spectral index image of the radio halo at 39′′. The contours are spaced by a factor of |
| In the text | |
|
Fig. 9 Exponential smooth of the spectral index α between 325 and 1400 MHz versus thermal-gas temperature T. We adopted a smoothing scale of 1 keV. |
| In the text | |
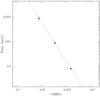 |
Fig. 10 Spectral index of the source C (see e.g. Fig. 1, top right panel) between 74 and 1400 MHz. |
| In the text | |
Current usage metrics show cumulative count of Article Views (full-text article views including HTML views, PDF and ePub downloads, according to the available data) and Abstracts Views on Vision4Press platform.
Data correspond to usage on the plateform after 2015. The current usage metrics is available 48-96 hours after online publication and is updated daily on week days.
Initial download of the metrics may take a while.