Fig. 1
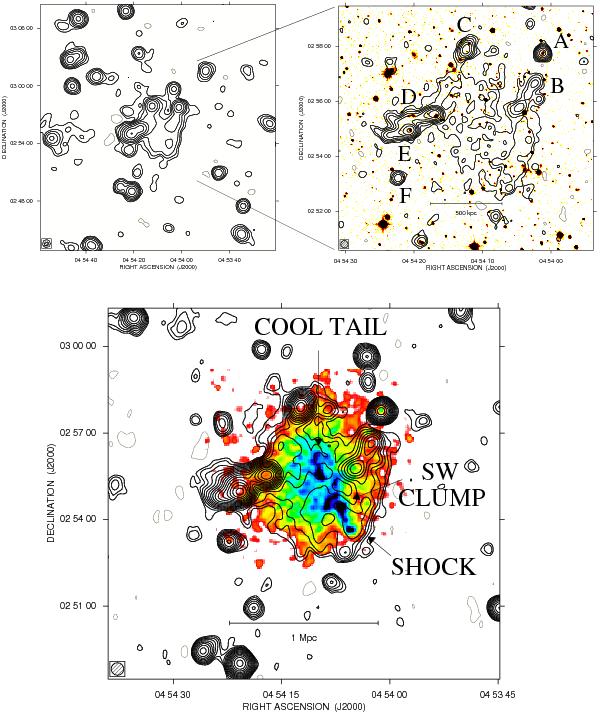
Top left panel: total intensity radio contours at 1400 MHz (VLA in D configuration) with an FWHM of 50′′ × 50′′. The contour levels are − 0.15 mJy/beam, 0.15 mJy/beam, and the rest are spaced by a factor 2. Top right panel: total intensity radio contours at 1400 MHz (VLA data in C configuration) with an FWHM of 16′′ × 16′′. The contour levels are − 75 μJy/beam, 75 μJy/beam, and the rest are spaced by a factor 2. The contours of the radio intensity are overlaid on the red plate of the Sloan Digital Sky Survey. Bottom panel: total intensity radio contours at 1400 MHz (combining VLA data in C and D configuration) with an FWHM of 26′′ × 26′′. The contour levels are − 90 μJy/beam, 90 μJy/beam, and the rest are spaced by a factor  . The contours of the radio intensity are overlaid on the ACIS-I Chandra X-ray adaptively smooth brightness image in the 0.8–4 keV band (Govoni et al. 2004) in colors.
Current usage metrics show cumulative count of Article Views (full-text article views including HTML views, PDF and ePub downloads, according to the available data) and Abstracts Views on Vision4Press platform.
Data correspond to usage on the plateform after 2015. The current usage metrics is available 48-96 hours after online publication and is updated daily on week days.
Initial download of the metrics may take a while.