Fig. 8
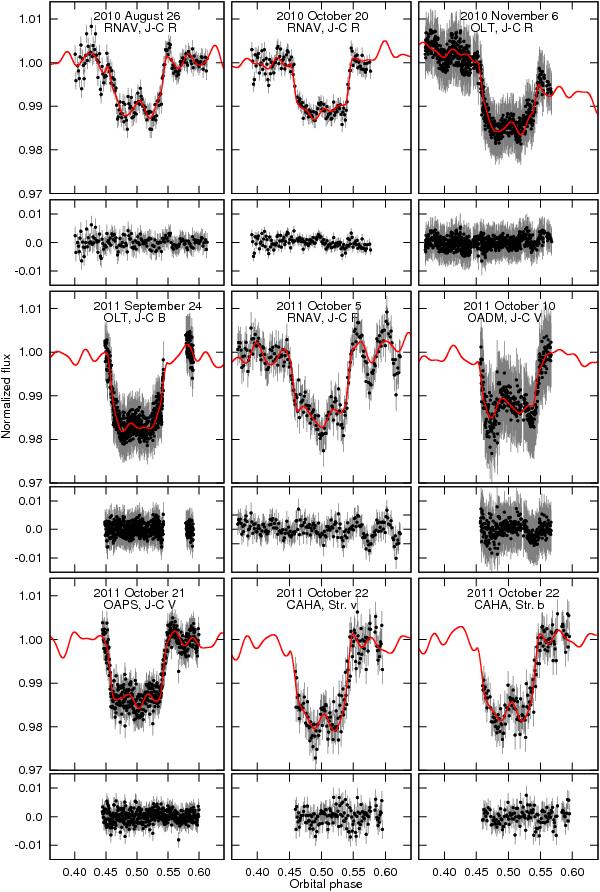
Top panels: the 19 primary transits in black points, along with the photometric error bars accounting for correlated noise, cf. Sect. 4.1. Overplotted in continuous red line is the best-fitted primary transit model modulated by the host star pulsations and the low-order normalization polynomial. Bottom panels: residuals.
Current usage metrics show cumulative count of Article Views (full-text article views including HTML views, PDF and ePub downloads, according to the available data) and Abstracts Views on Vision4Press platform.
Data correspond to usage on the plateform after 2015. The current usage metrics is available 48-96 hours after online publication and is updated daily on week days.
Initial download of the metrics may take a while.