Fig. 9
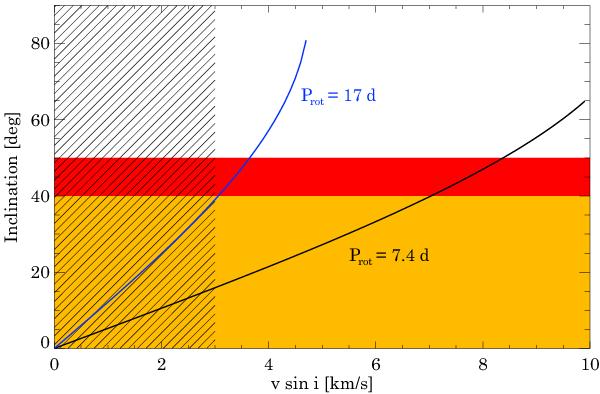
Inclination vs. vsini. The solid lines indicate the period of 7.4 d (obtained from the RV analysis) and 17 d (a lower limit obtained from the inclination constraint). The hatched area marks the vsini constraint from the FEROS and HARPS spectra; the orange and red areas mark the constraints for disk inclination from Sipos et al. (2009) and Goto et al. (2011), respectively.
Current usage metrics show cumulative count of Article Views (full-text article views including HTML views, PDF and ePub downloads, according to the available data) and Abstracts Views on Vision4Press platform.
Data correspond to usage on the plateform after 2015. The current usage metrics is available 48-96 hours after online publication and is updated daily on week days.
Initial download of the metrics may take a while.