Free Access
Fig. 7
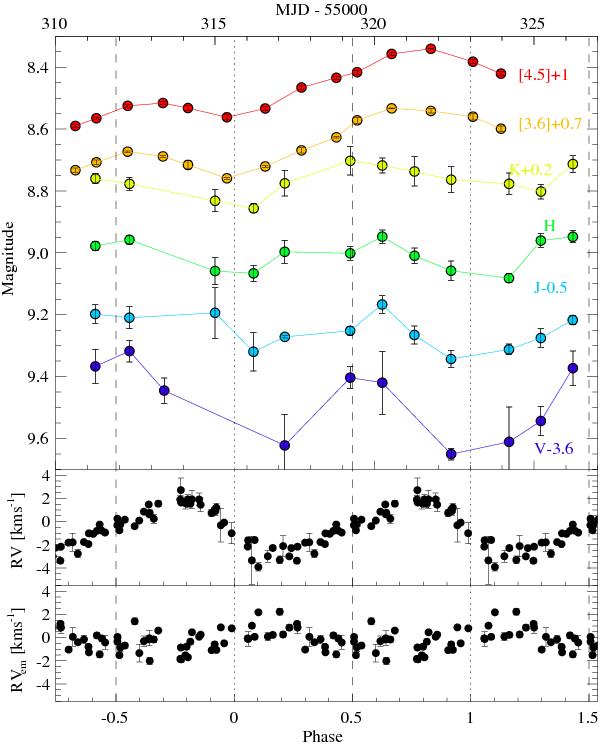
Light curves and RV curves of EX Lup. For clarity, the light curves were shifted along the y-axis by the amounts indicated on the right side. Dashed and dotted lines mark when the RV equals the systemic velocity.
Current usage metrics show cumulative count of Article Views (full-text article views including HTML views, PDF and ePub downloads, according to the available data) and Abstracts Views on Vision4Press platform.
Data correspond to usage on the plateform after 2015. The current usage metrics is available 48-96 hours after online publication and is updated daily on week days.
Initial download of the metrics may take a while.