Fig. 2
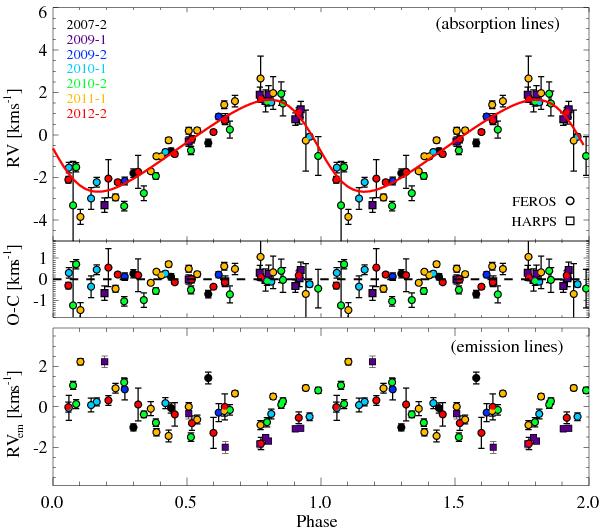
Top: best Keplerian fit to the absorption line RVs for the combined FEROS and HARPS RV data set (with RVlin). The different colors indicate different observing seasons (-1 stands for the first half of the year, -2 for the second half). Circles represent FEROS and squares HARPS data points. Middle: residua with the same color and shape coding. Bottom: emission line RVs with the same color and shape coding.
Current usage metrics show cumulative count of Article Views (full-text article views including HTML views, PDF and ePub downloads, according to the available data) and Abstracts Views on Vision4Press platform.
Data correspond to usage on the plateform after 2015. The current usage metrics is available 48-96 hours after online publication and is updated daily on week days.
Initial download of the metrics may take a while.