Fig. A.1
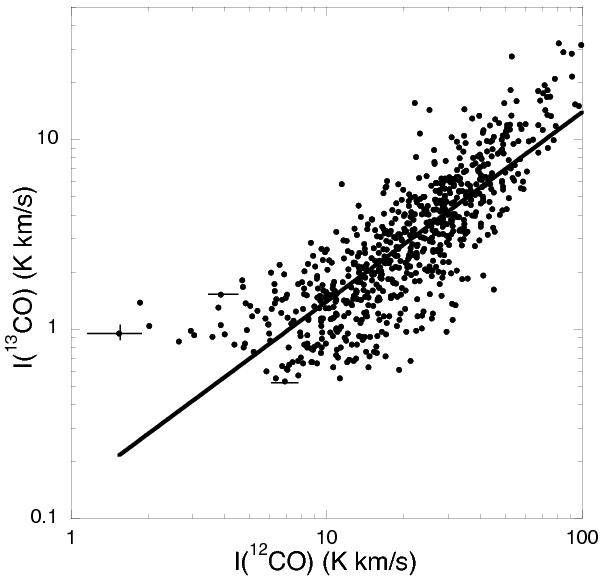
Scatter plot of I(13CO) versus I(12CO) for the 734 sources detected in 13CO. The solid line is a linear fit to the data points in the figure and indicates that I(12CO) is, on average, a good linear tracer of H2 column density for I(12CO) > 5 K km s-1. The 1-σ noise is indicated on two representative low intensity points; on the scale of this figure it can be seen that the signal-to-noise ratio is very high except for a few of the weakest 12CO points. The detection limits are given in Table 2.
Current usage metrics show cumulative count of Article Views (full-text article views including HTML views, PDF and ePub downloads, according to the available data) and Abstracts Views on Vision4Press platform.
Data correspond to usage on the plateform after 2015. The current usage metrics is available 48-96 hours after online publication and is updated daily on week days.
Initial download of the metrics may take a while.