Fig. 5
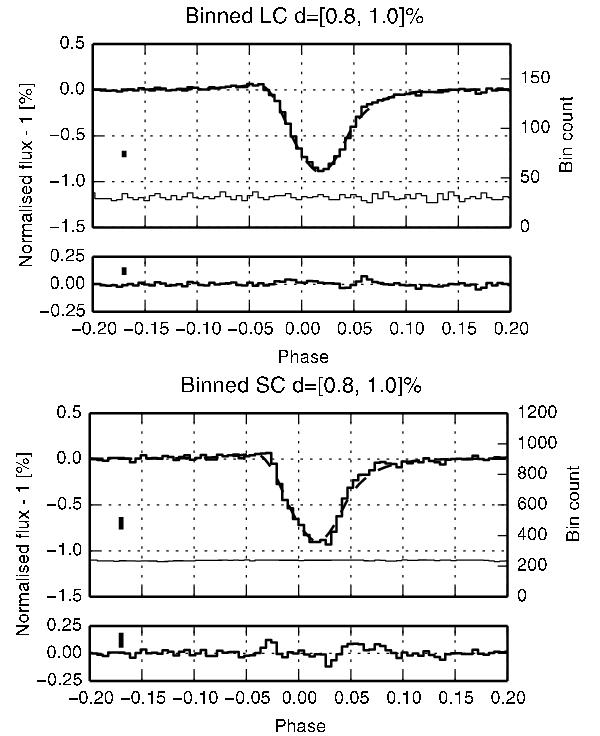
Phase-folded, normalised flux binned in 192 bins for long cadence (top) and short cadence (bottom) data for transits with depths from 0.8% to 1.0%. The number of data points in each bin is indicated with horizontal bars according to the right y-axis. The model is based on the parameters from the “deep” column in Table 2. The best-fitting model deviates from the short cadence data during both ingress and egress. The vertical bar indicates the median three-sigma error of the binned flux. The residual rms for these data in the phase displayed are 2.0 × 10⁻⁴ and 3.7 × 10⁻⁴ respectively, showing a greater mismatch between the short cadence data and the 1D model.
Current usage metrics show cumulative count of Article Views (full-text article views including HTML views, PDF and ePub downloads, according to the available data) and Abstracts Views on Vision4Press platform.
Data correspond to usage on the plateform after 2015. The current usage metrics is available 48-96 hours after online publication and is updated daily on week days.
Initial download of the metrics may take a while.