Fig. 2
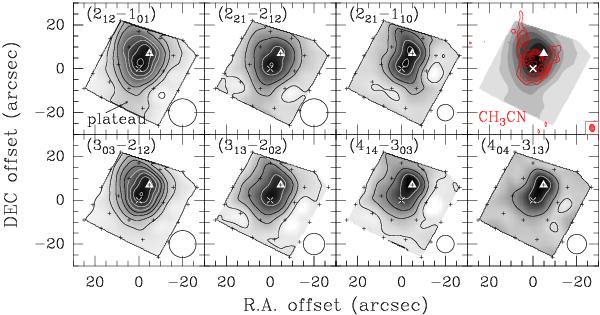
PACS maps of H2O line fluxes (increasing upper-level energy from top left to bottom right). First contour corresponds to the 1σ flux level of each transition. The contour step is 2σ in all lines except for the o-H2O (212 − 101) and o-H2O (303 − 212), for which the contour step is 6σ and 3σ, respectively, where σ is listed in Table 2. The top right panel shows an overlay of the o-H2O (212 − 101) map (gray scale) with the PdBI CH3CN (8–7) K = 0–2 image (red contours) from Codella et al. (2009) tracing the bow-shock. The synthesized beam of PdBI,  ×
×  (PA = 10°), is shown in the bottom right corner of this panel. Plus signs mark the central position of each spaxel of the PACS field of view. The white triangle indicates the position of the CO peak traced by high-Jup PACS lines (Benedettini et al. 2012) and the × symbol depicts the nominal position of the B1 shock. The half power beam width (HPBW) of each transition is indicated in the bottom right corner of each panel and is listed in Table 2.
Current usage metrics show cumulative count of Article Views (full-text article views including HTML views, PDF and ePub downloads, according to the available data) and Abstracts Views on Vision4Press platform.
Data correspond to usage on the plateform after 2015. The current usage metrics is available 48-96 hours after online publication and is updated daily on week days.
Initial download of the metrics may take a while.