Fig. 6
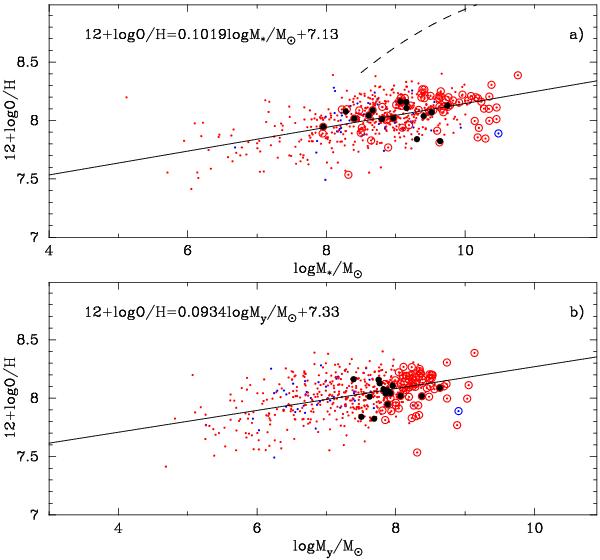
a) Mass-metallicity relation. Symbols are the same as in Fig. 4. The linear likelihood regression is shown by solid line. The sample of galaxies is the same as in Fig. 5. The galaxies with red WISE colours W1 − W2 ≥ 2 mag are indicated by large black filled circles and the galaxies with SFR(Hα) ≥ 10 M⊙ yr-1 are encircled. For comparison, the mass-metallicity relation for 53 000 SDSS star-forming galaxies (Tremonti et al. 2004) is shown by a dashed line. b) Relation between the mass of the young stellar population and the oxygen abundance. The linear likelihood regression is shown by solid line. The galaxies with red WISE colours W1 − W2 ≥ 2 mag are resembled by large black filled circles and the galaxies with SFR(Hα) ≥ 10 M⊙ yr-1 are encircled.
Current usage metrics show cumulative count of Article Views (full-text article views including HTML views, PDF and ePub downloads, according to the available data) and Abstracts Views on Vision4Press platform.
Data correspond to usage on the plateform after 2015. The current usage metrics is available 48-96 hours after online publication and is updated daily on week days.
Initial download of the metrics may take a while.